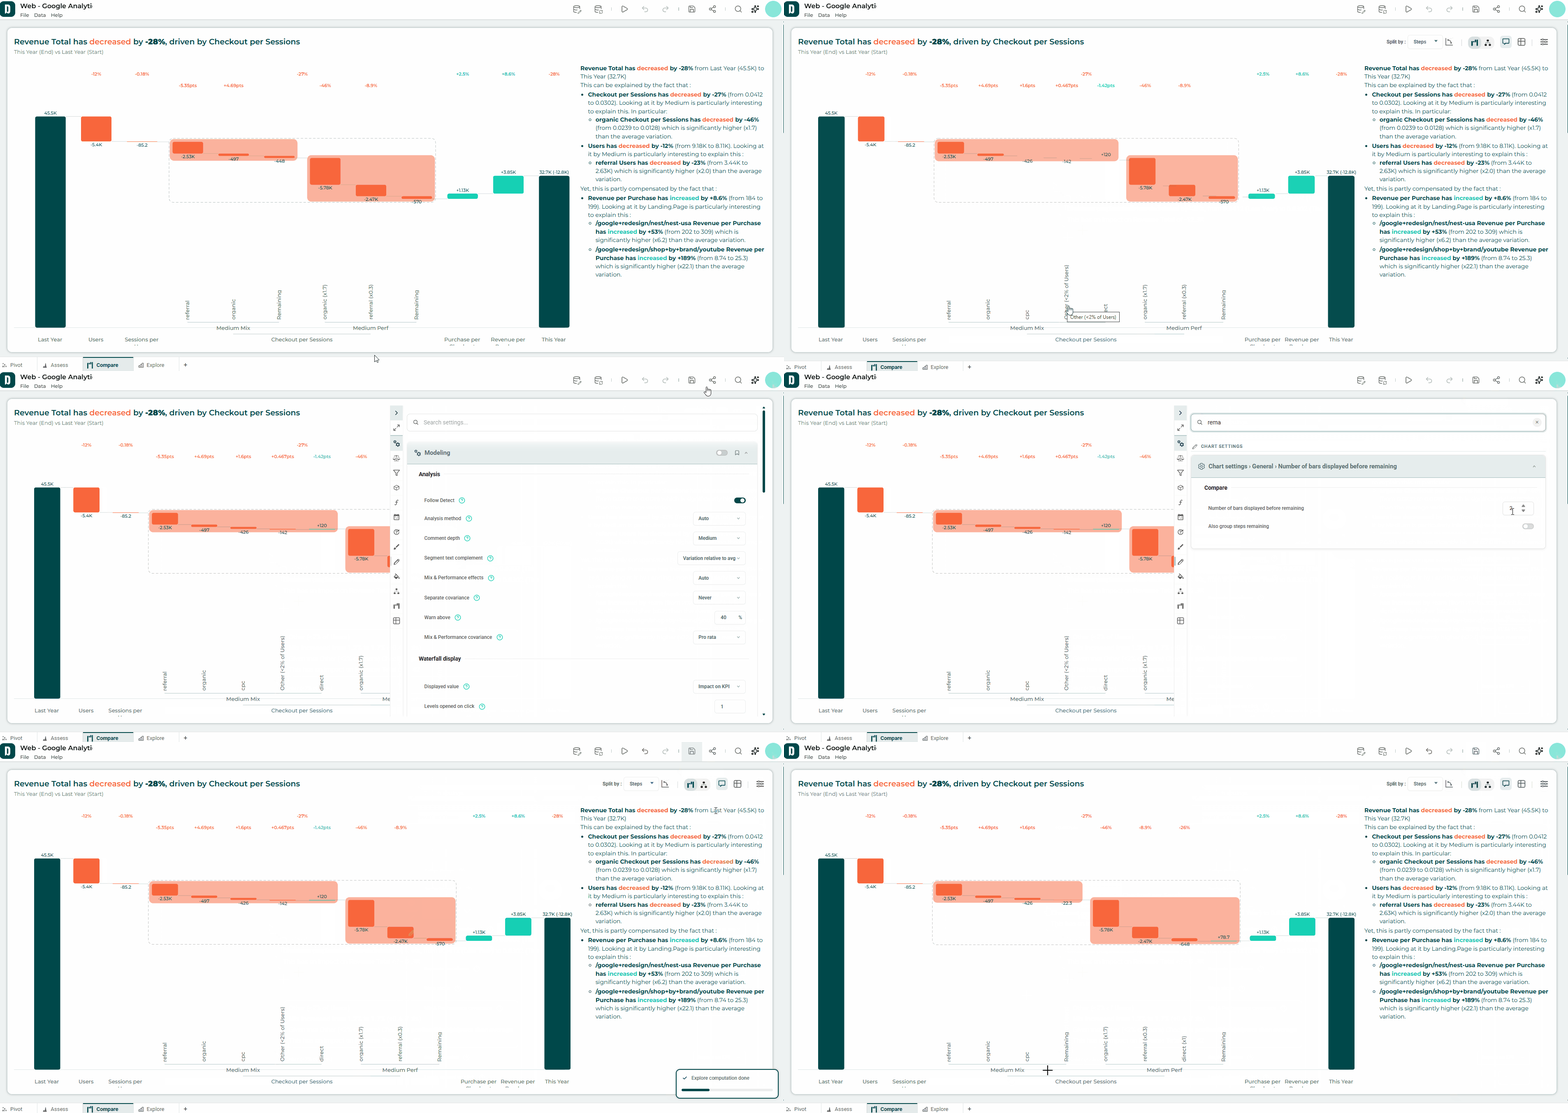
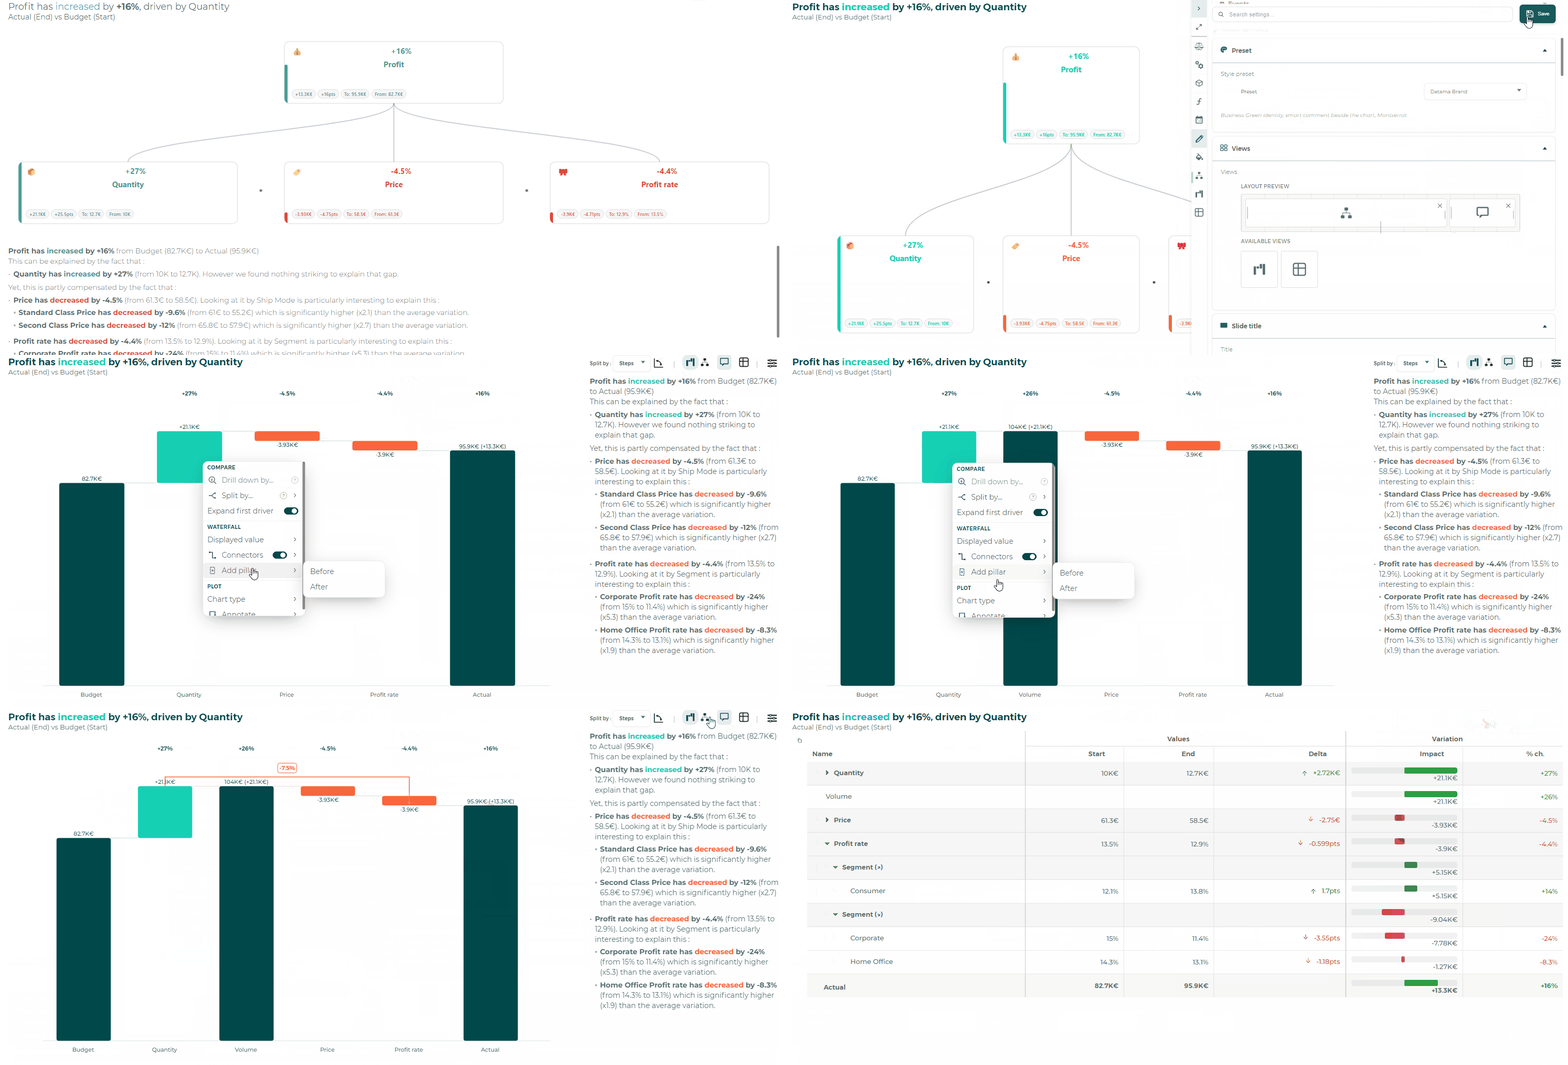
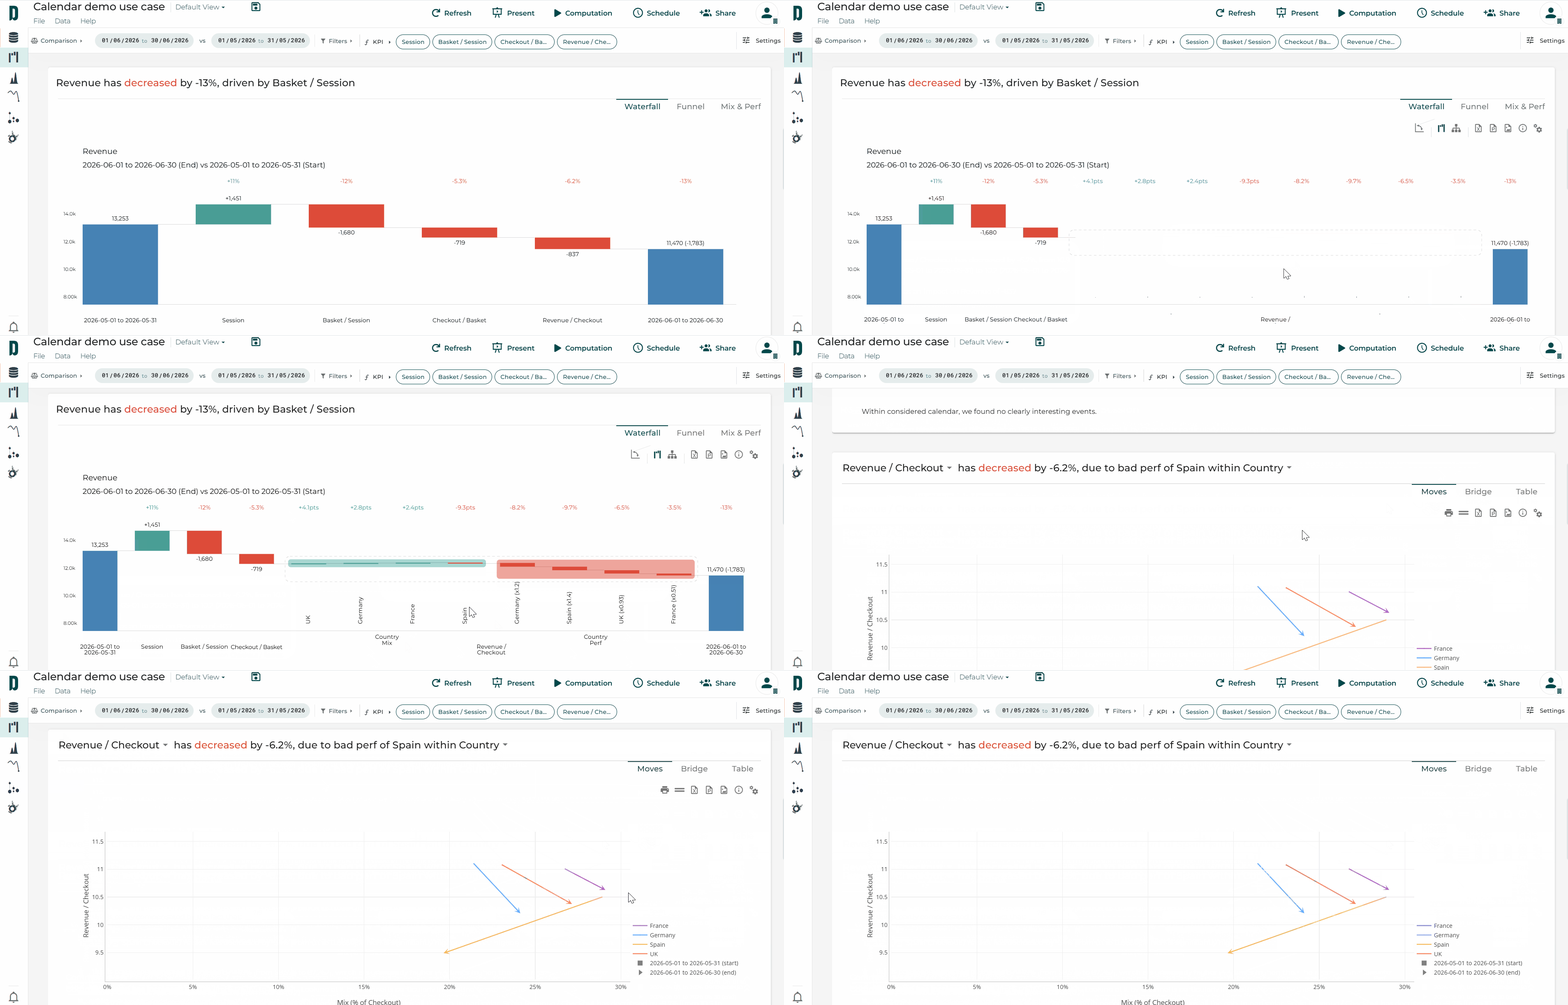
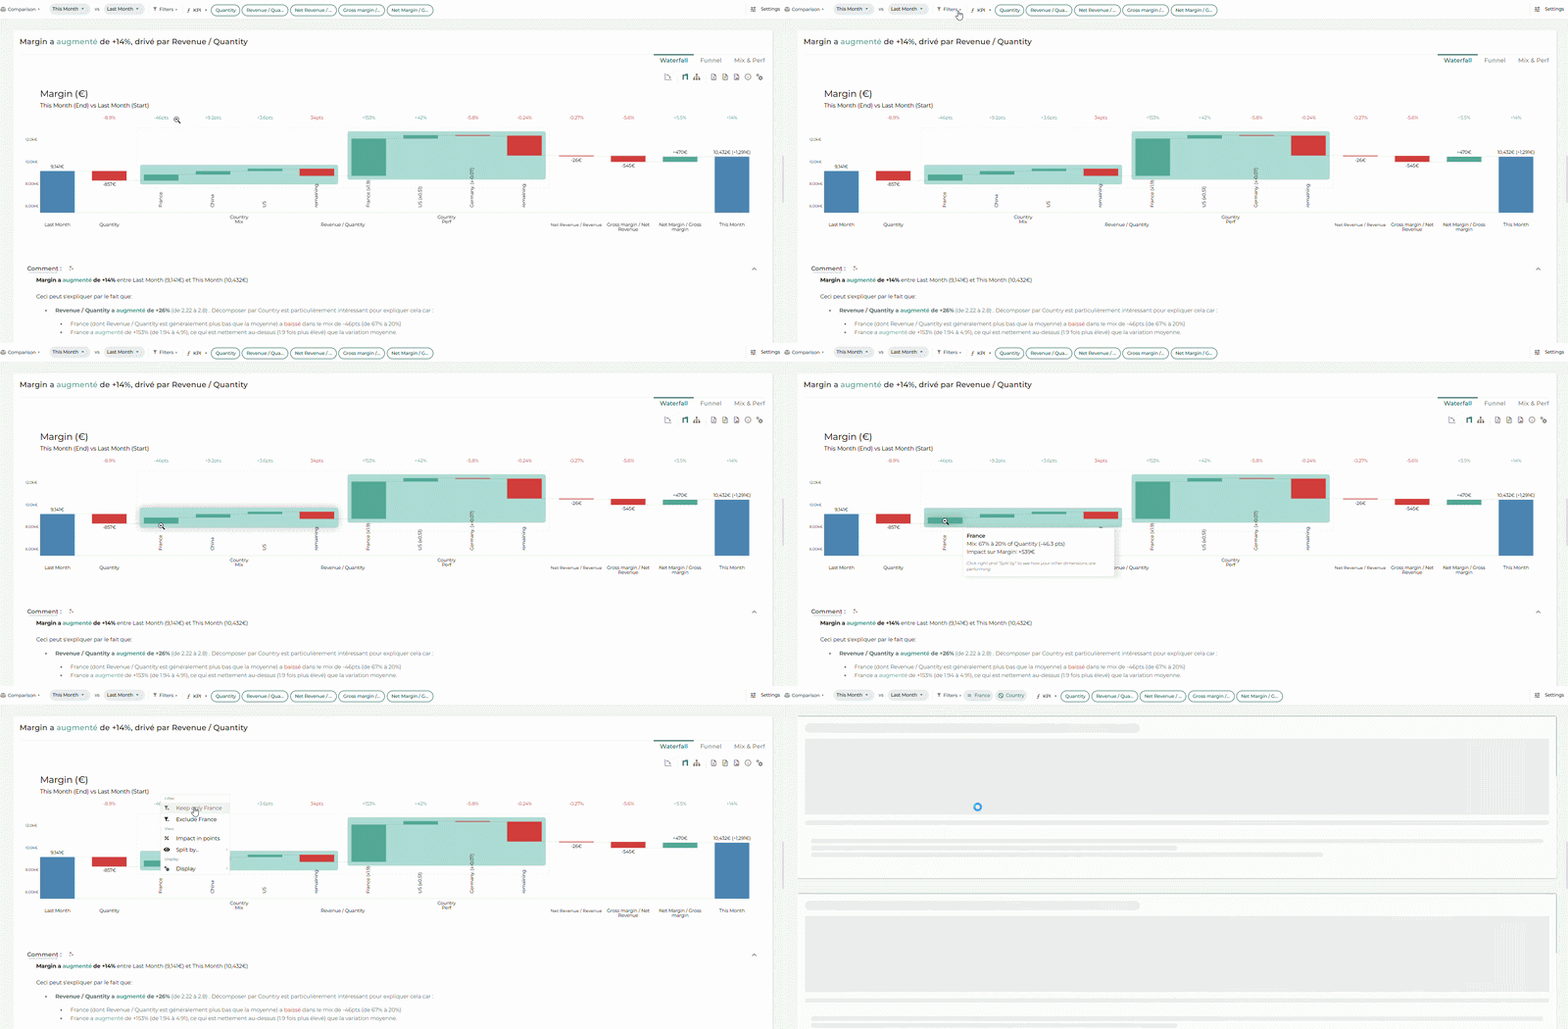
Too many bars on your waterfall when you explore a step ? 📊
In Datama Compare, only the most impacting bars stay visible. The rest are grouped into a single Remaining bar, so your story stays readable and nothing is lost.
How to do it 👇
🔢 Settings › Compare › Items displayed: choose how many bars stay visible before Remaining (6 by default, up to 50)
🖱️ Click Remaining to expand more elements
↩️ Right-click › Regroup remaining to collapse them again
🧮 Group equation steps: turn it on to let market equation steps be folded into Remaining too (off by default)
✨ A clean slide for your audience, and the full detail one click away.
Want the audience to see the gap, not just read it? 🏹
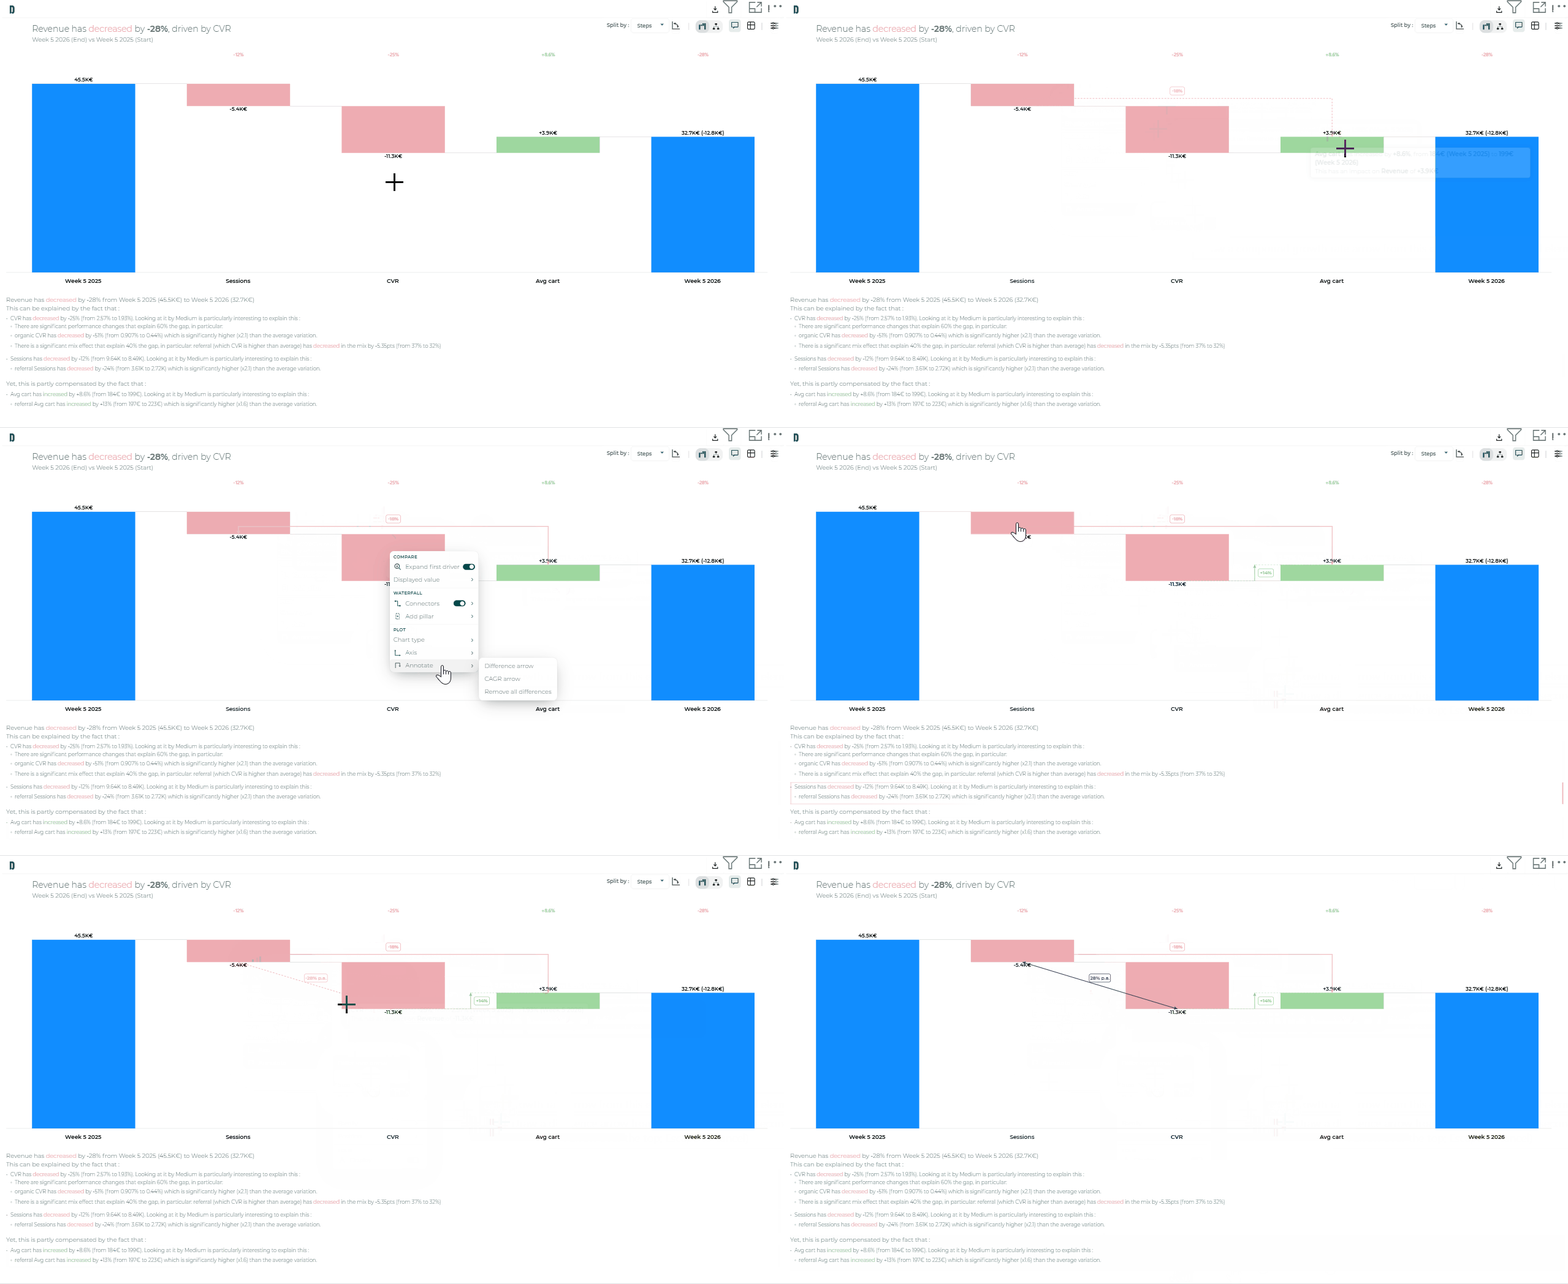
In Datama Compare, add a think-cell style Difference arrow between two bars of your Waterfall. It stays anchored to the data, so it survives drill, reverse axis and layout changes.
How to do it 👇
🖱️ Right-click the Waterfall and choose Annotate › Difference arrow
📏 Link two bars: the level difference between neighbours, or the total difference across a range of steps
📈 Optional: a CAGR-style growth arrow
🎨 Click the line to cycle through the three style presets
🔢 Click the label to switch between % change, impact in points and both
✨ The key gap of your story, highlighted in one slide-ready visual.
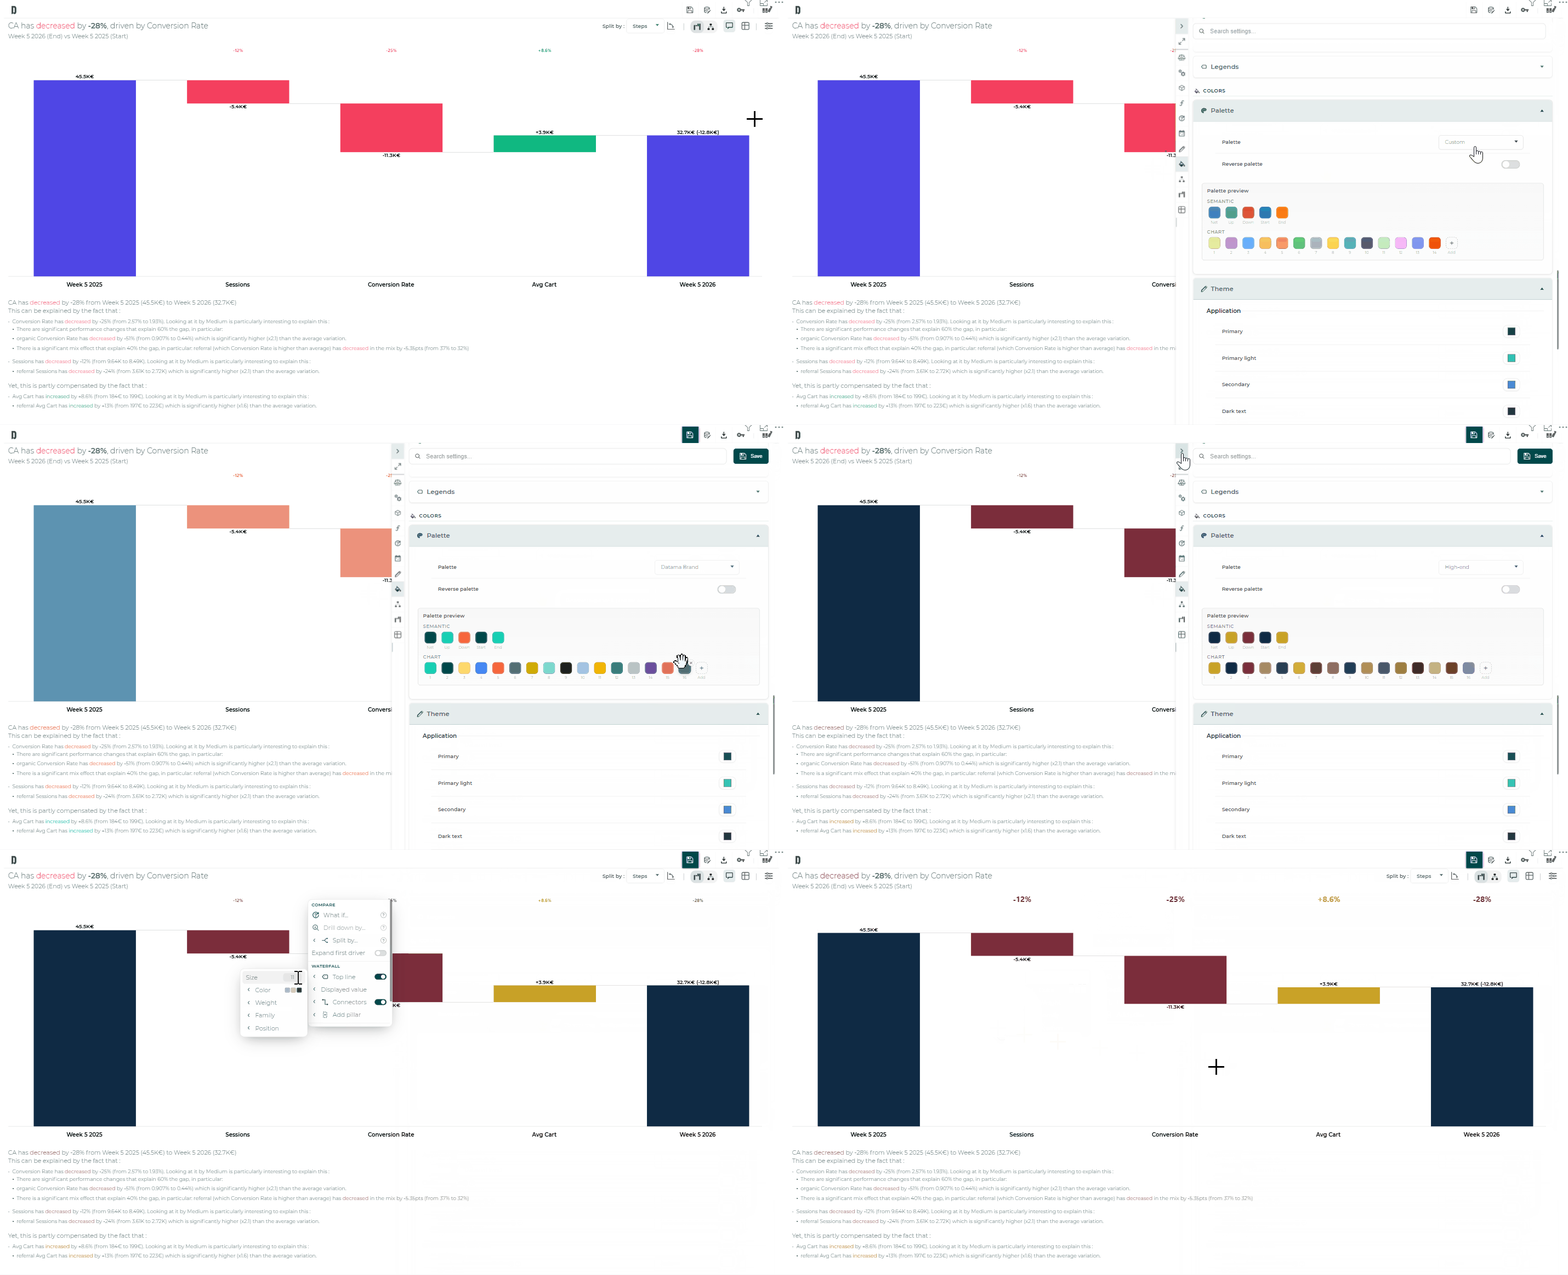
Four keyboard shortcuts to speed up Datama Compare
Still reaching for the mouse every time you change view? ⌨️
The redesigned Datama Compare extension has four keyboard shortcuts. Flip your story from Waterfall to Tree, reverse the axes or jump straight to a setting, without leaving the keyboard.
Try them 👇
🔄 Shift + R: reverse the axes of the Waterfall and / or the Tree
📊 Shift + W: switch to the Waterfall view
🌳 Shift + T: switch from the Waterfall to the Tree
🔎 Shift + S: open the settings panel with the cursor already in the search bar, which also finds the options of the analysis panels (Comparison, Modeling, Dimensions…)
✨ Faster live demos, and the right setting one search away.
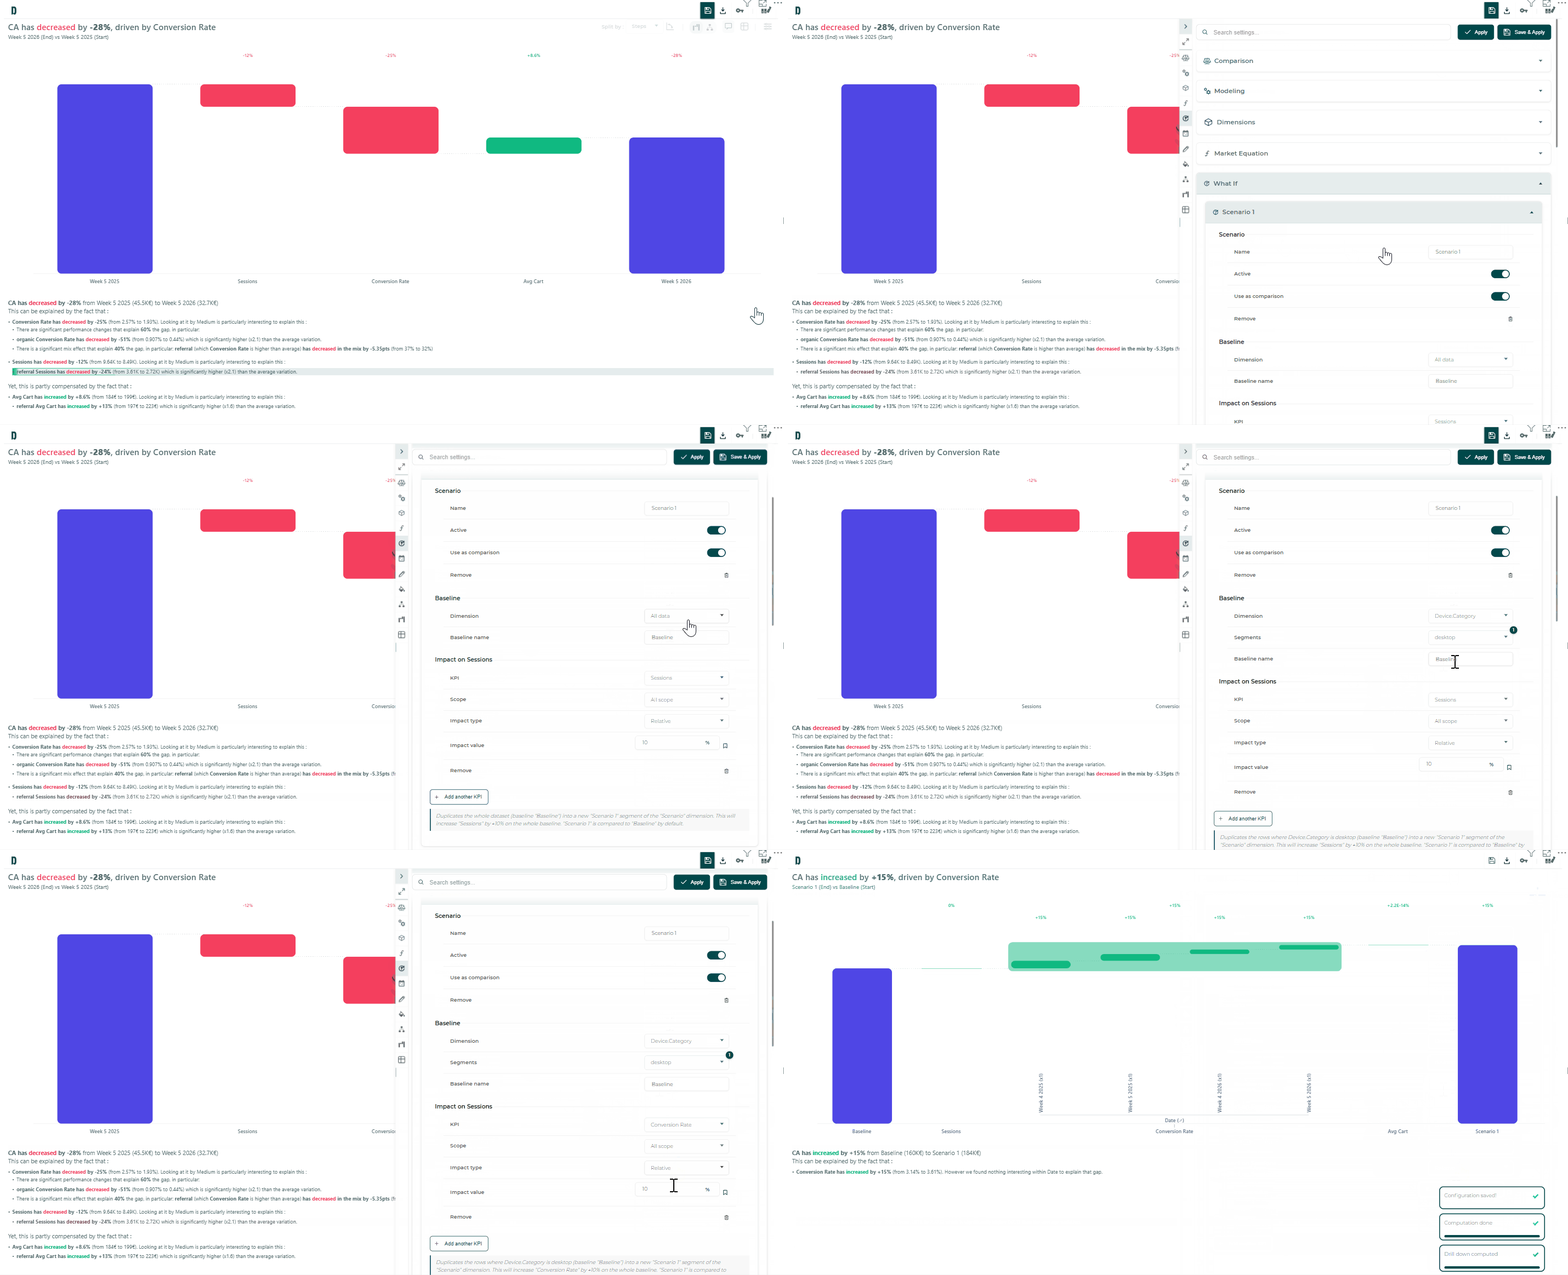
What would happen to your KPI if conversion improved by 10%? 🔮
With What If in the Datama Compare extension, simulate it on your own data and read the answer in the usual Waterfall, Tree or Table. No spreadsheet on the side.
How to do it 👇
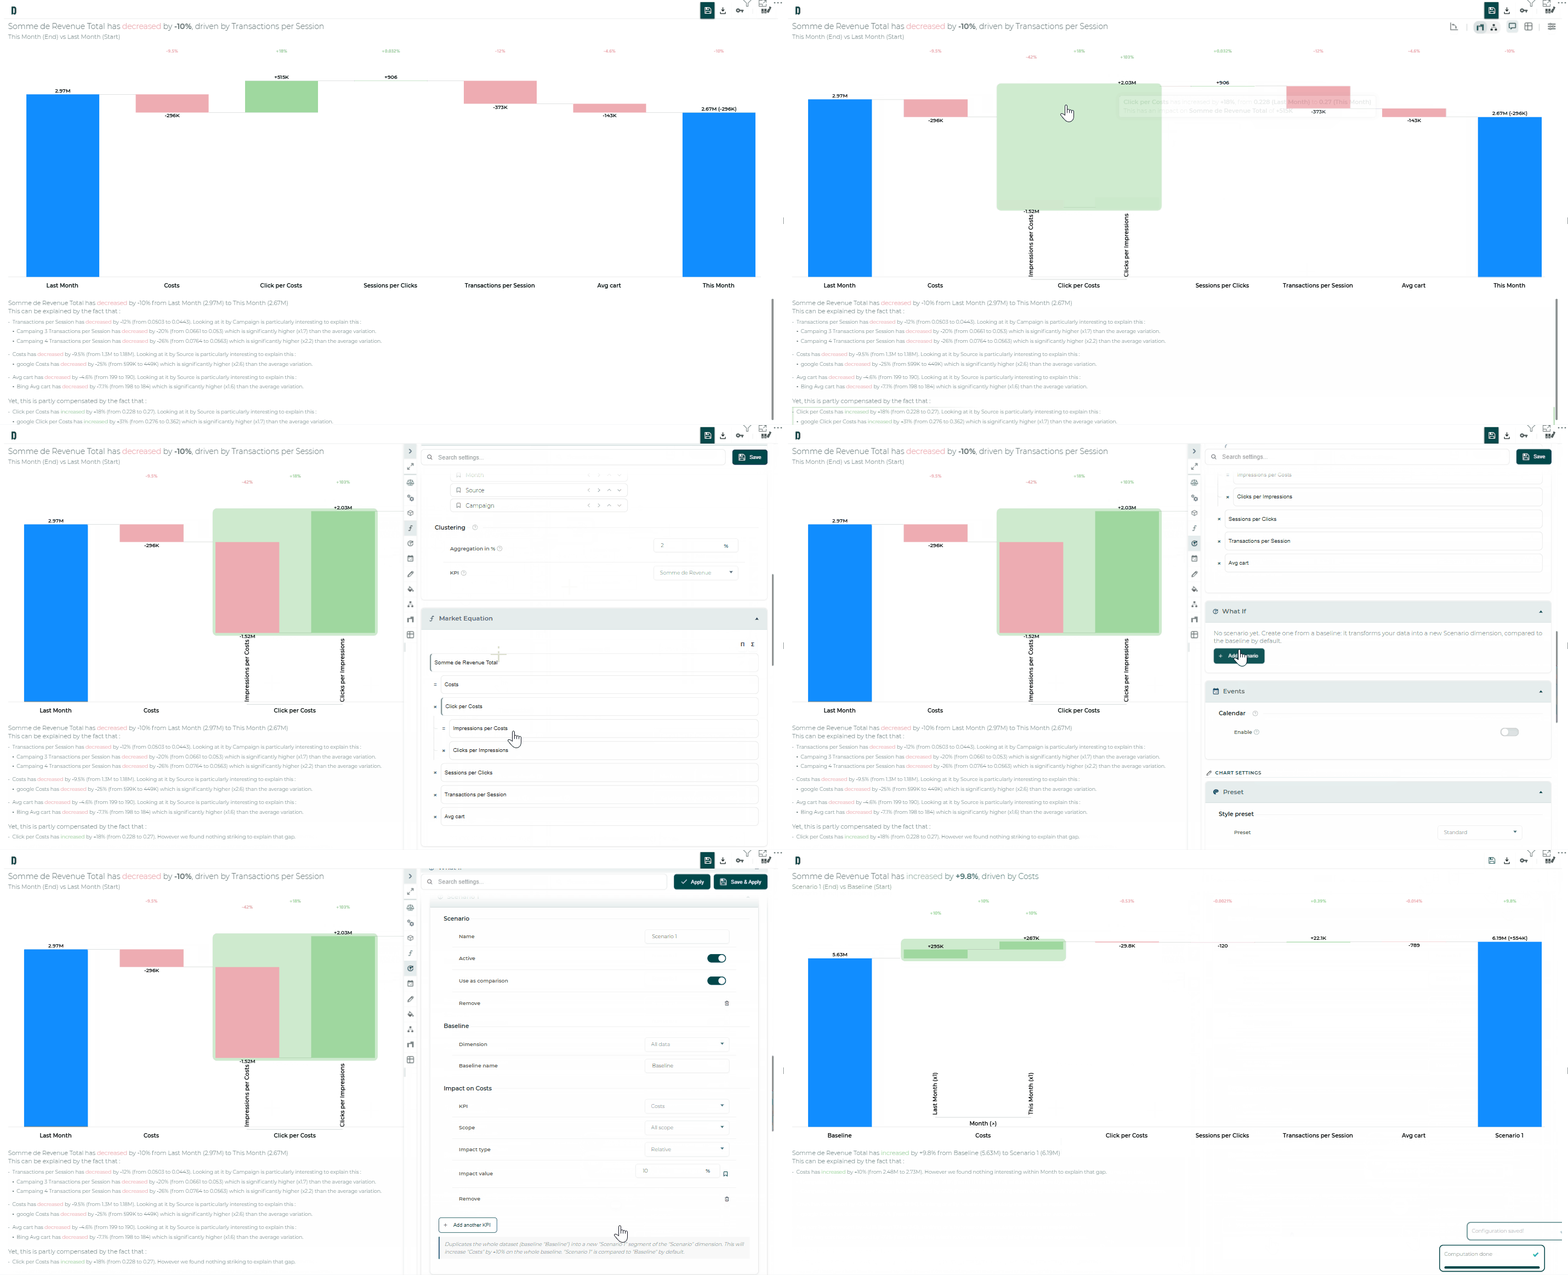
⚙️ Open Settings › What If and add a scenario: give it a name and pick the baseline (whole dataset, or a dimension with selected segments)
🎯 Add a KPI impact: choose a step of your market equation, an optional segment scope, and a relative (%) or absolute change
✅ Turn on Use as comparison, then Apply: the waterfall now compares baseline vs scenario
🖱️ Faster: right-click a waterfall bar to create a scenario already prefilled with the step and segment
📌 Pin an impact to get a live shortcut on the visual
✨ Know which lever is worth pulling before you pull it.
Does your market equation break down into several levels? 🔎
With ‘Sub-steps’ on the Datama Compare extension, nest equations inside a step. Example: Revenue = Sessions × Conversion Rate × AOV 💶, then detail the Conversion Rate as Add to Cart Rate × Cart to Order Rate 🛒. Sub-steps apply to both the Waterfall 📊 and the Tree 🌳.
How to use them 👇
⚙️ Open Settings › Market Equation and build your steps with the card editor: hover a card → ‘Add a sub-step’, indent / outdent, edit the formula
🏷️ Prefer meaningful step names: formulas reference steps by name, and names must be unique among steps (the Main KPI may reuse a step label)
🖱️ On the Waterfall 📊, right-click a composite bar → ‘Split by › Sub-steps’ to open it into its child sub-steps, and find the same hierarchy in the Tree 🌳
✨ Perfect to explain a variation down to the smallest stage of your funnel 🚀
What If scenarios 🔮 : simulate a KPI impact and watch it flow through your Waterfall, Tree, or Table.
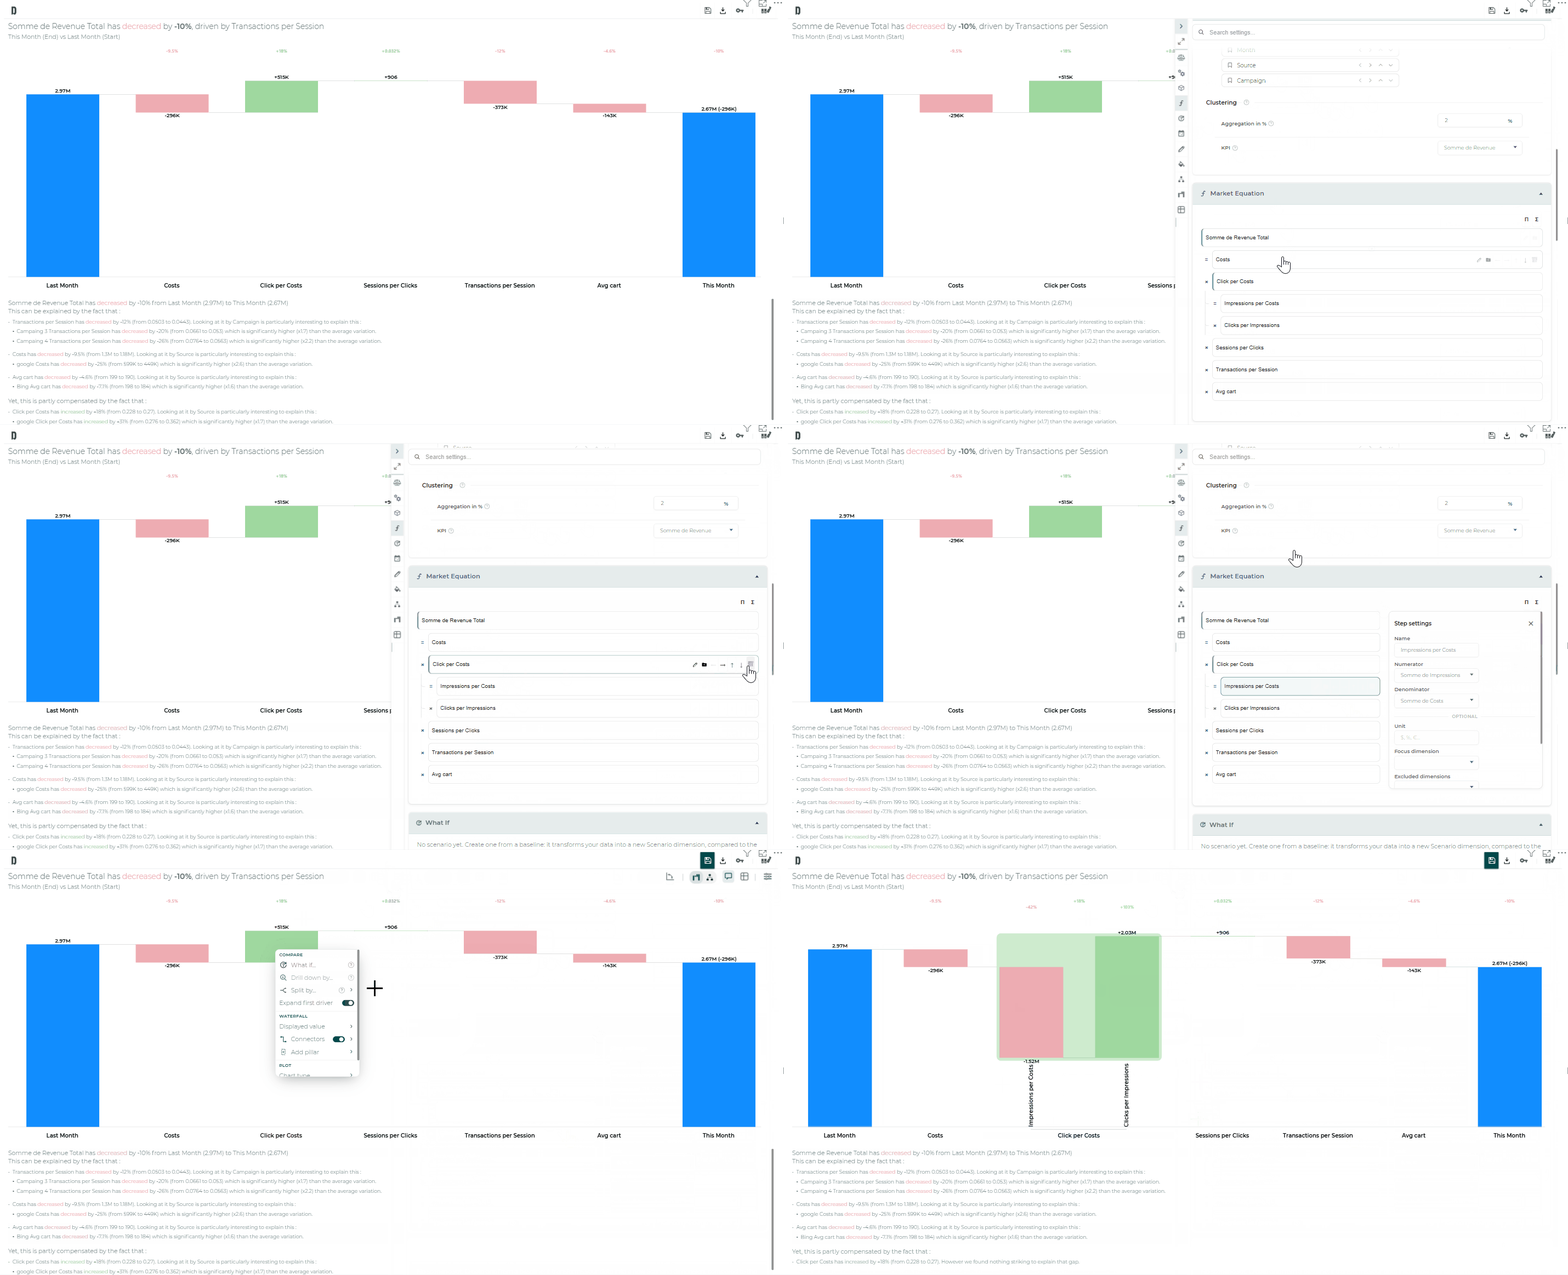
Sub-steps 🧩 : break a step into its own mini equation, then split its bar by sub-step.
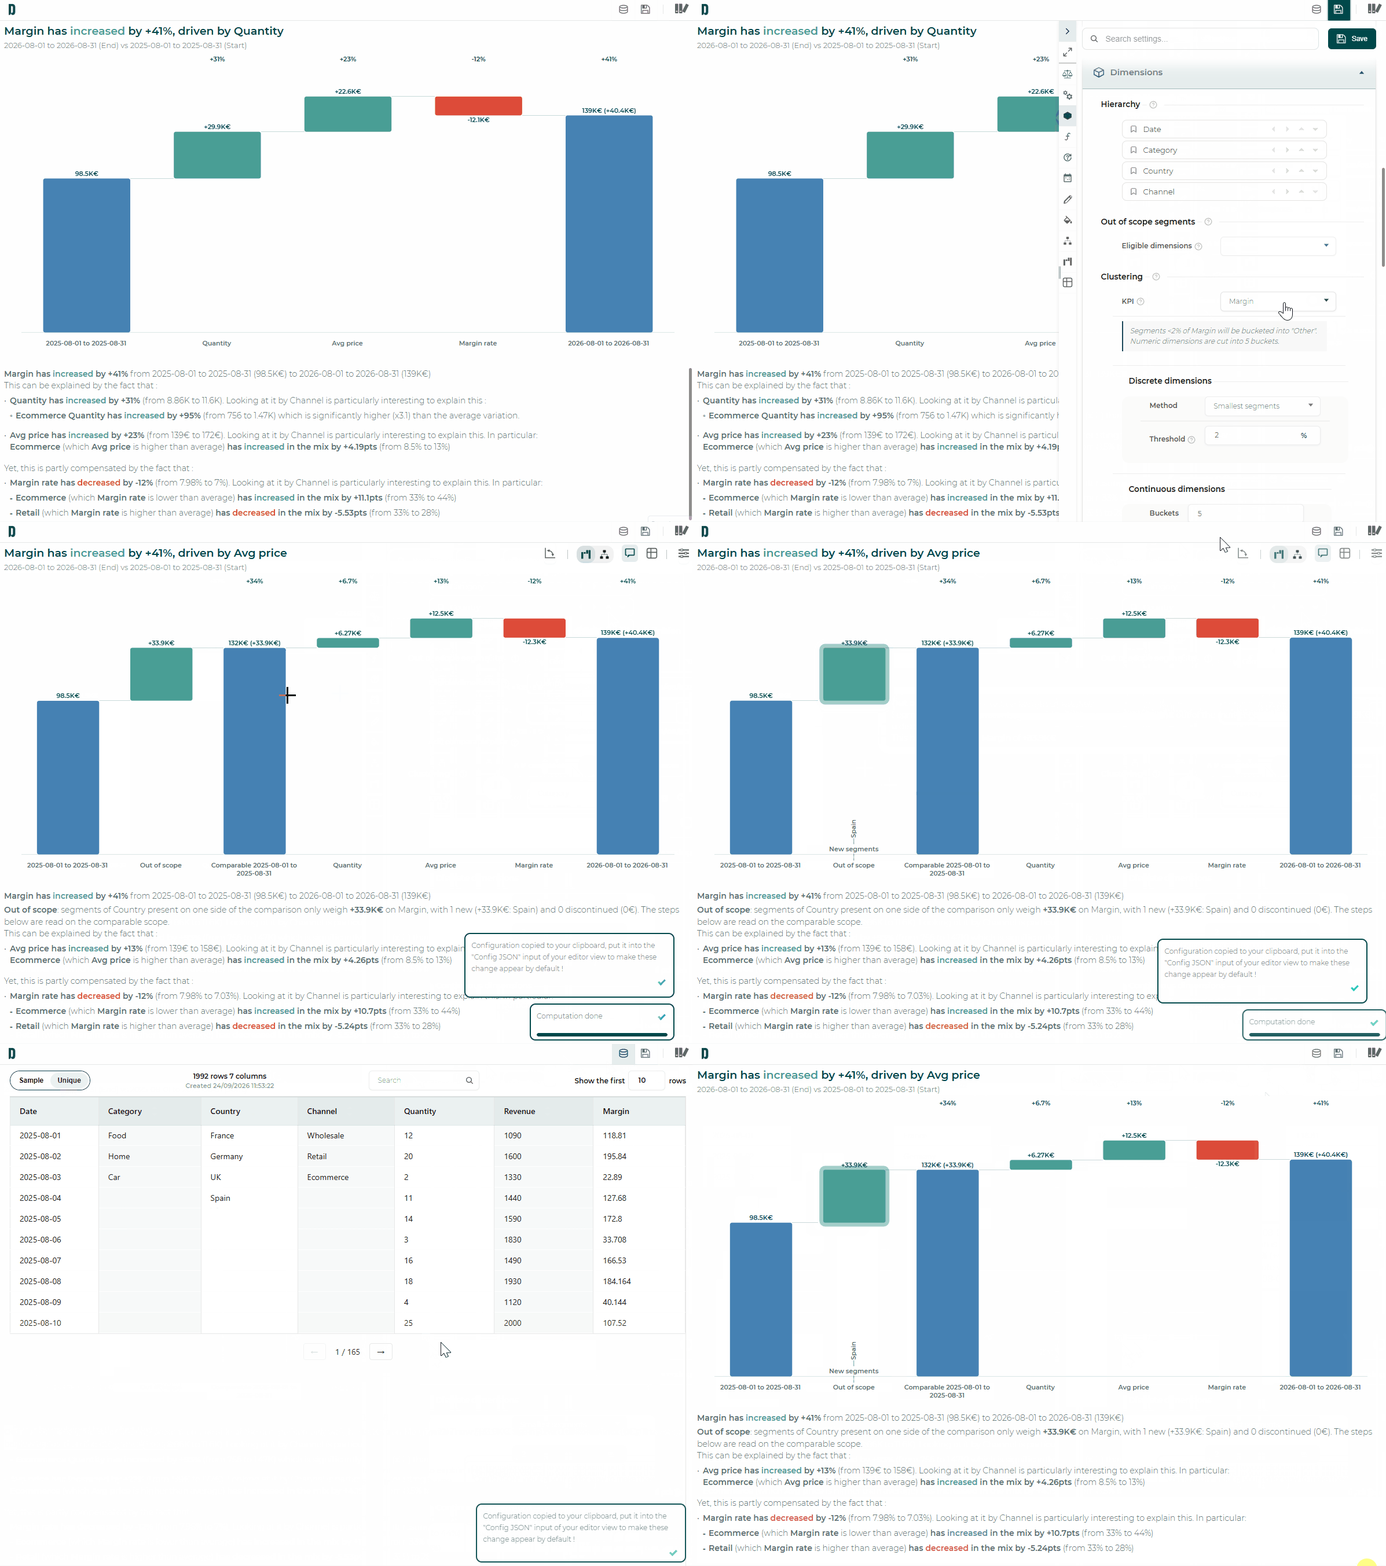
Covariance, tamed ⚖️ : choose per step if it should catch the covariance, or isolate it in its own bar.
Remaining bars 📊 : the 6 most impacting bars stay visible by default (up to 50), equation steps stay out unless you opt in, right-click to Regroup remaining.
Datama Compare just got a major upgrade — and your waterfall analysis will never feel the same 🚀
The redesigned Compare is now rolling out in marketplace extensions (Power BI, Tableau, Looker Studio, Qlik, Excel, and more). Here is what changes the game:
Drill without limits : explore by dimension or by step, as deep as your data goes, with smooth morphing bars and a narrative that follows every split
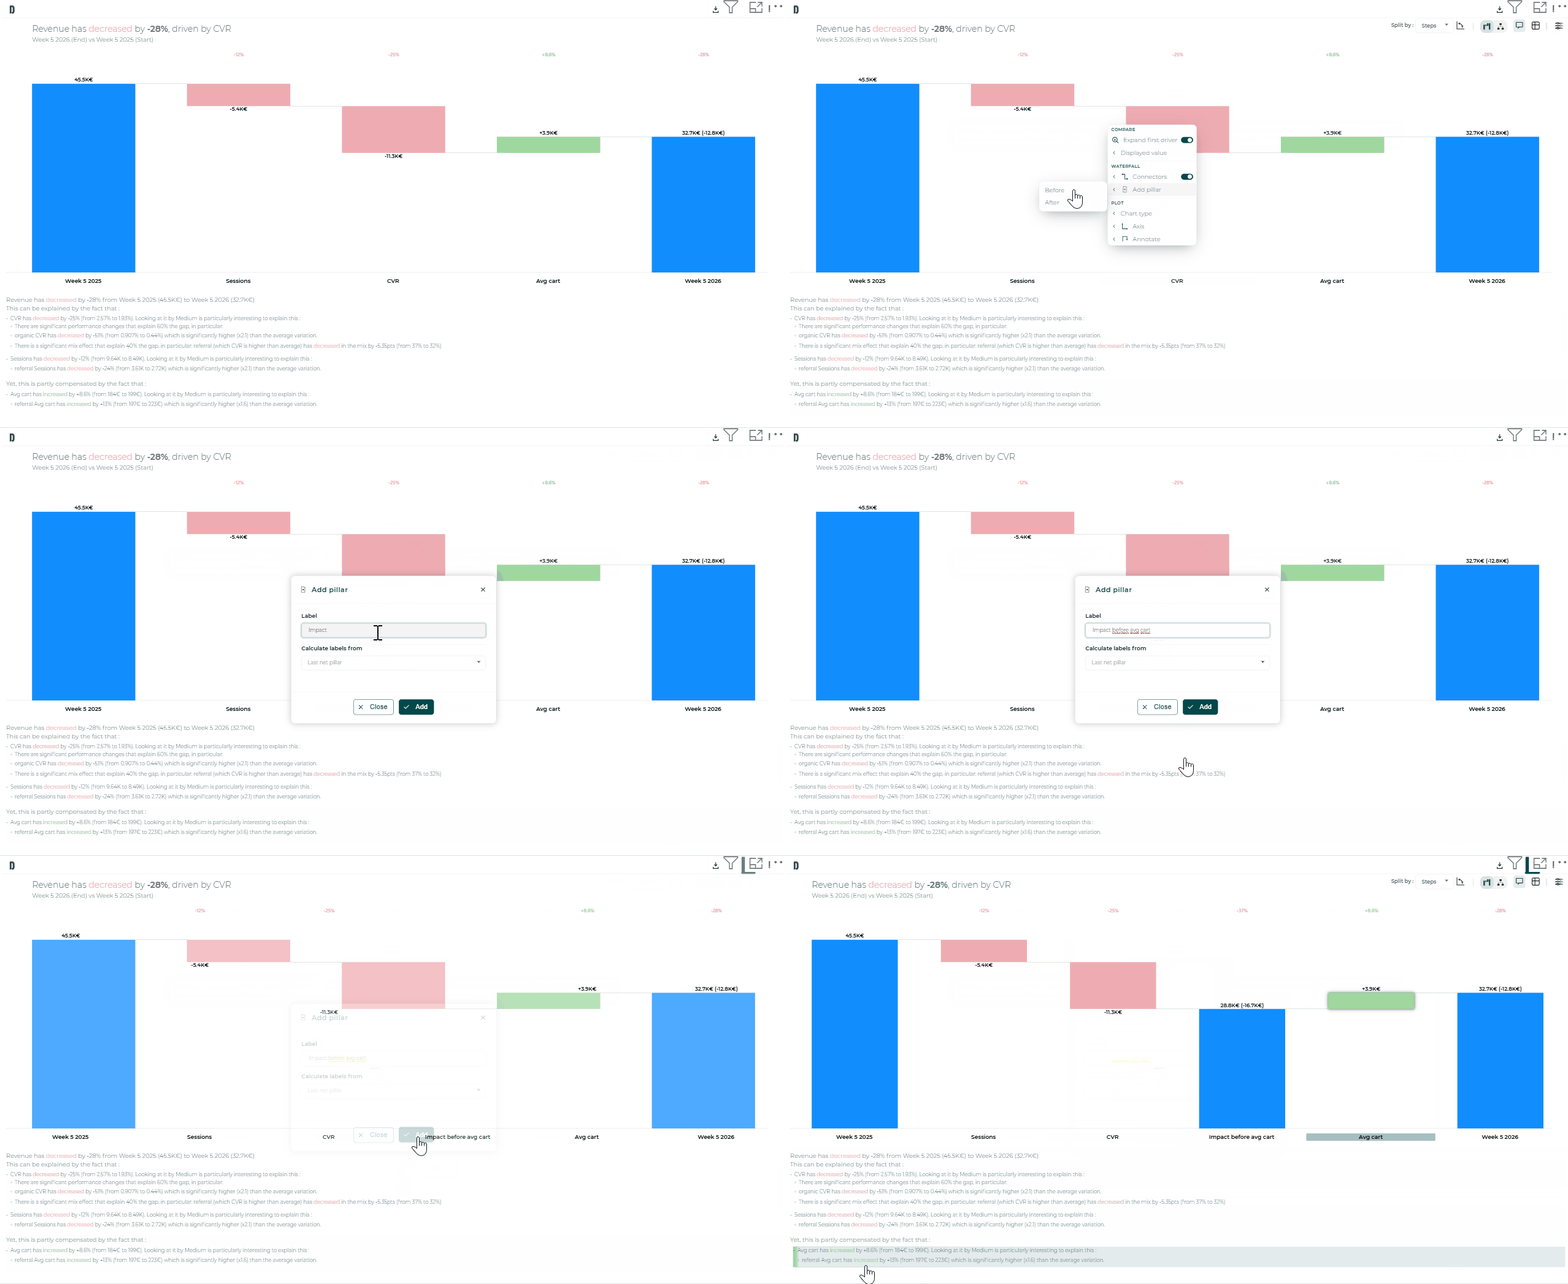
Stage your story : drop custom pillars on the waterfall (“After mix”, “After price”) and define dimension hierarchies (Country → Region → City) in seconds
One view : pin Waterfall, Table, Tree, and Comment side by side; every hover and drill stays in sync
Settings where you need them : right-click any bar, use the hover shortcut bar, or open the searchable side panel; no more hunting for the right toggle
👉 Open Compare in your favorite BI tool and feel the difference. Same serverless security, far more power at your fingertips.
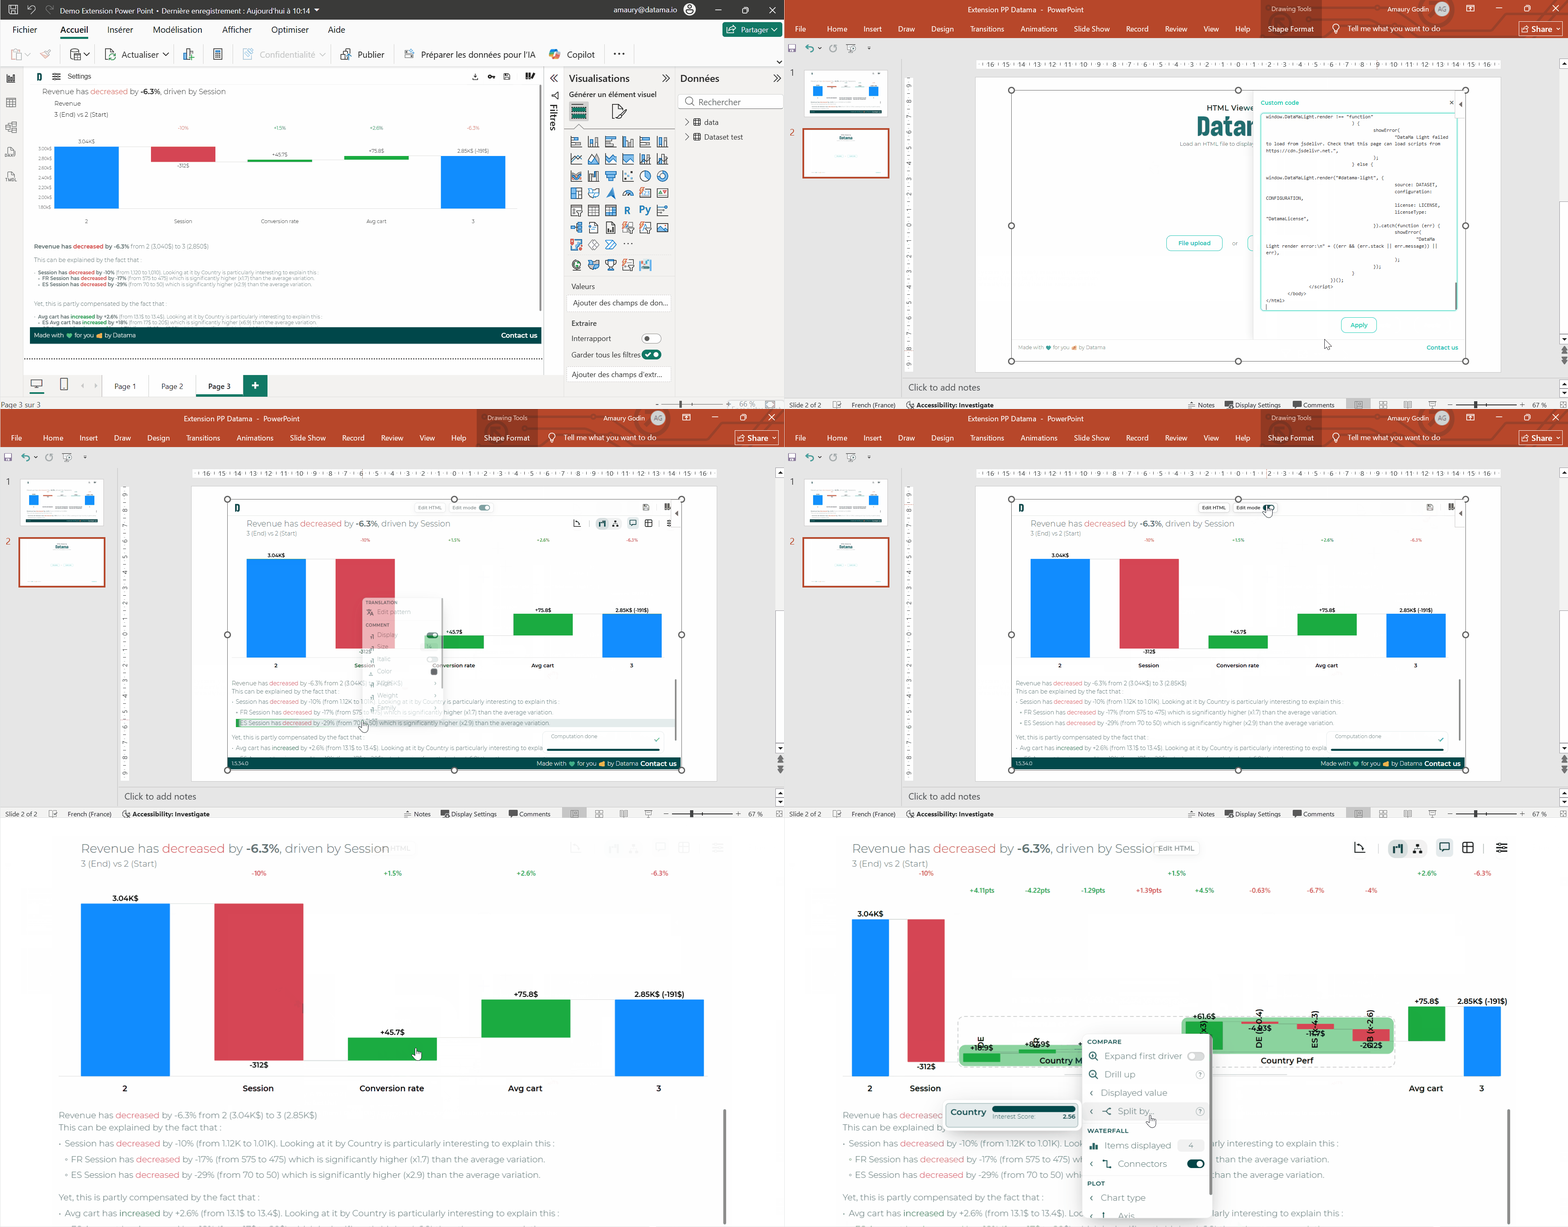
Would you like to display your Datama charts interactively rather than as screenshots in your PowerPoint slides? 📊
With the free HTML viewer by Datama PowerPoint add-in, keep Compare, Detect, Assess, and Explore interactive inside your presentation—including in slideshow mode.
How to use it:
Install the add-in from the PowerPoint marketplace (search for HTML viewer by Datama or Datama) 🔌
In another Datama extension (Compare, Detect, Assess et Explore), click on the Export button ⬇️
In PowerPoint, import via File upload or paste the HTML in Custom code 📥
✨ Same interactivity as in the source extension (zoom, drill-down, filters)—with a fixed dataset from the HTML export.
Completely free, as a complement to your existing Datama extensions.
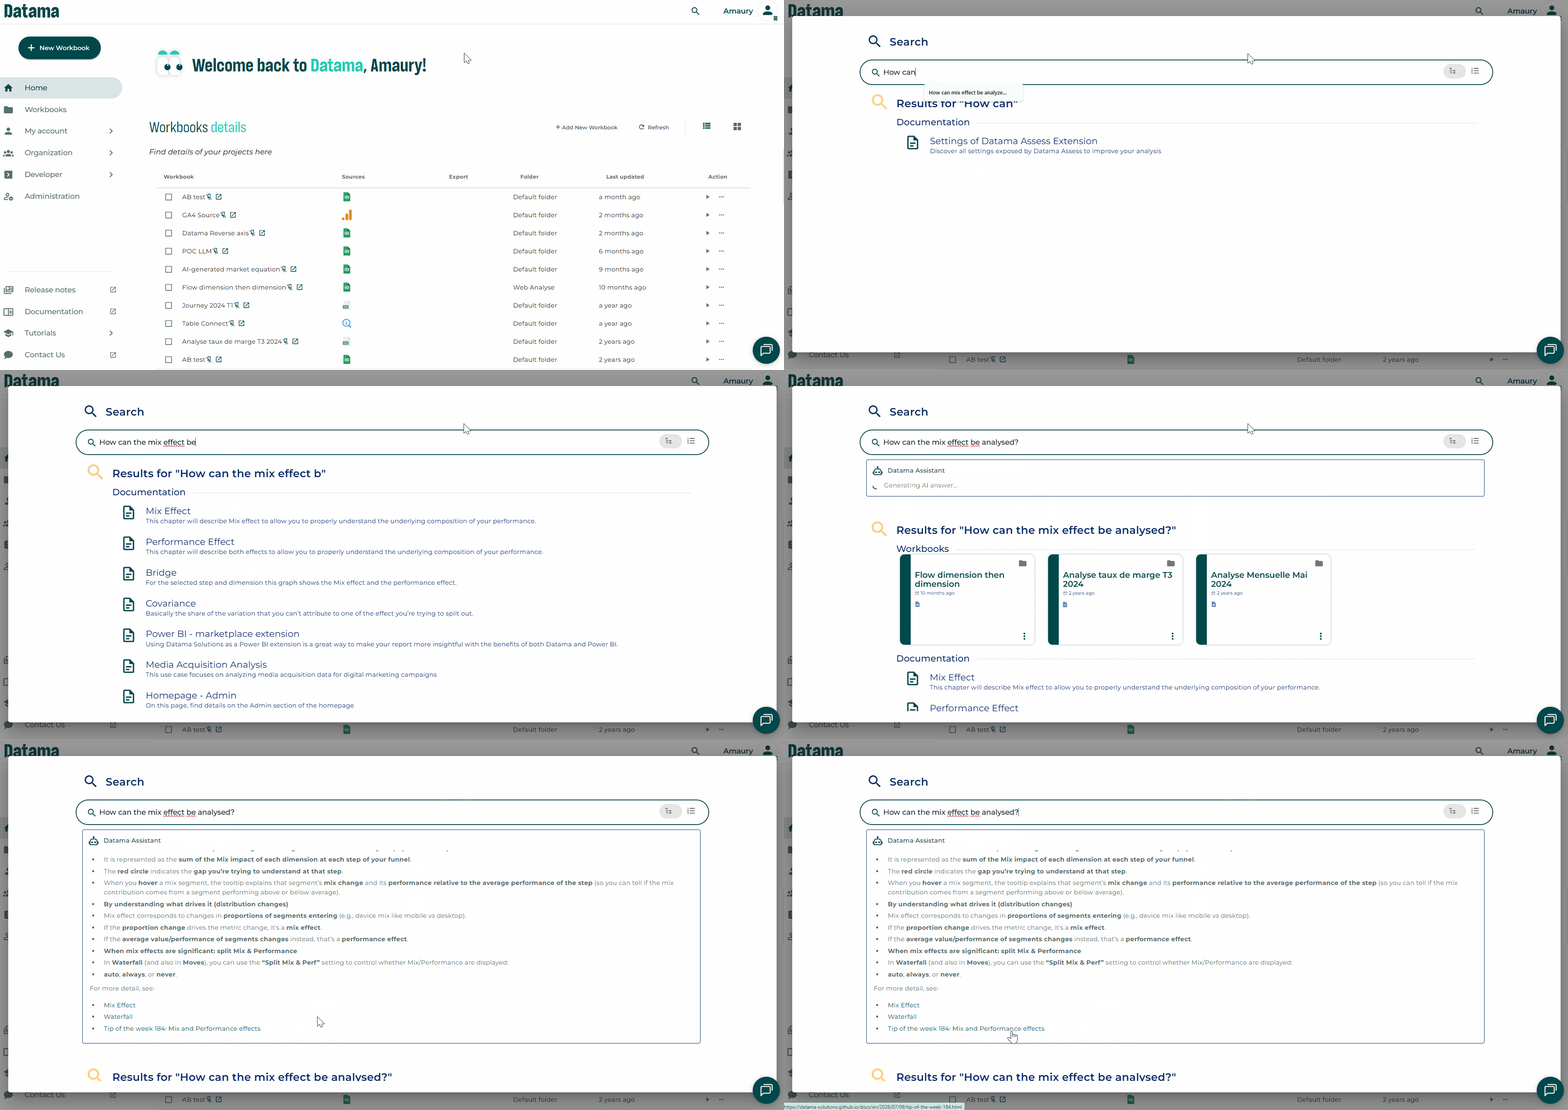
Use the search bar on all page with a “CTRL + F” shortcut 🔍
✨ The AI is now built directly into the Datama search bar and connected to our documentation. Simply ask your question in natural language, and get the answer instantly!
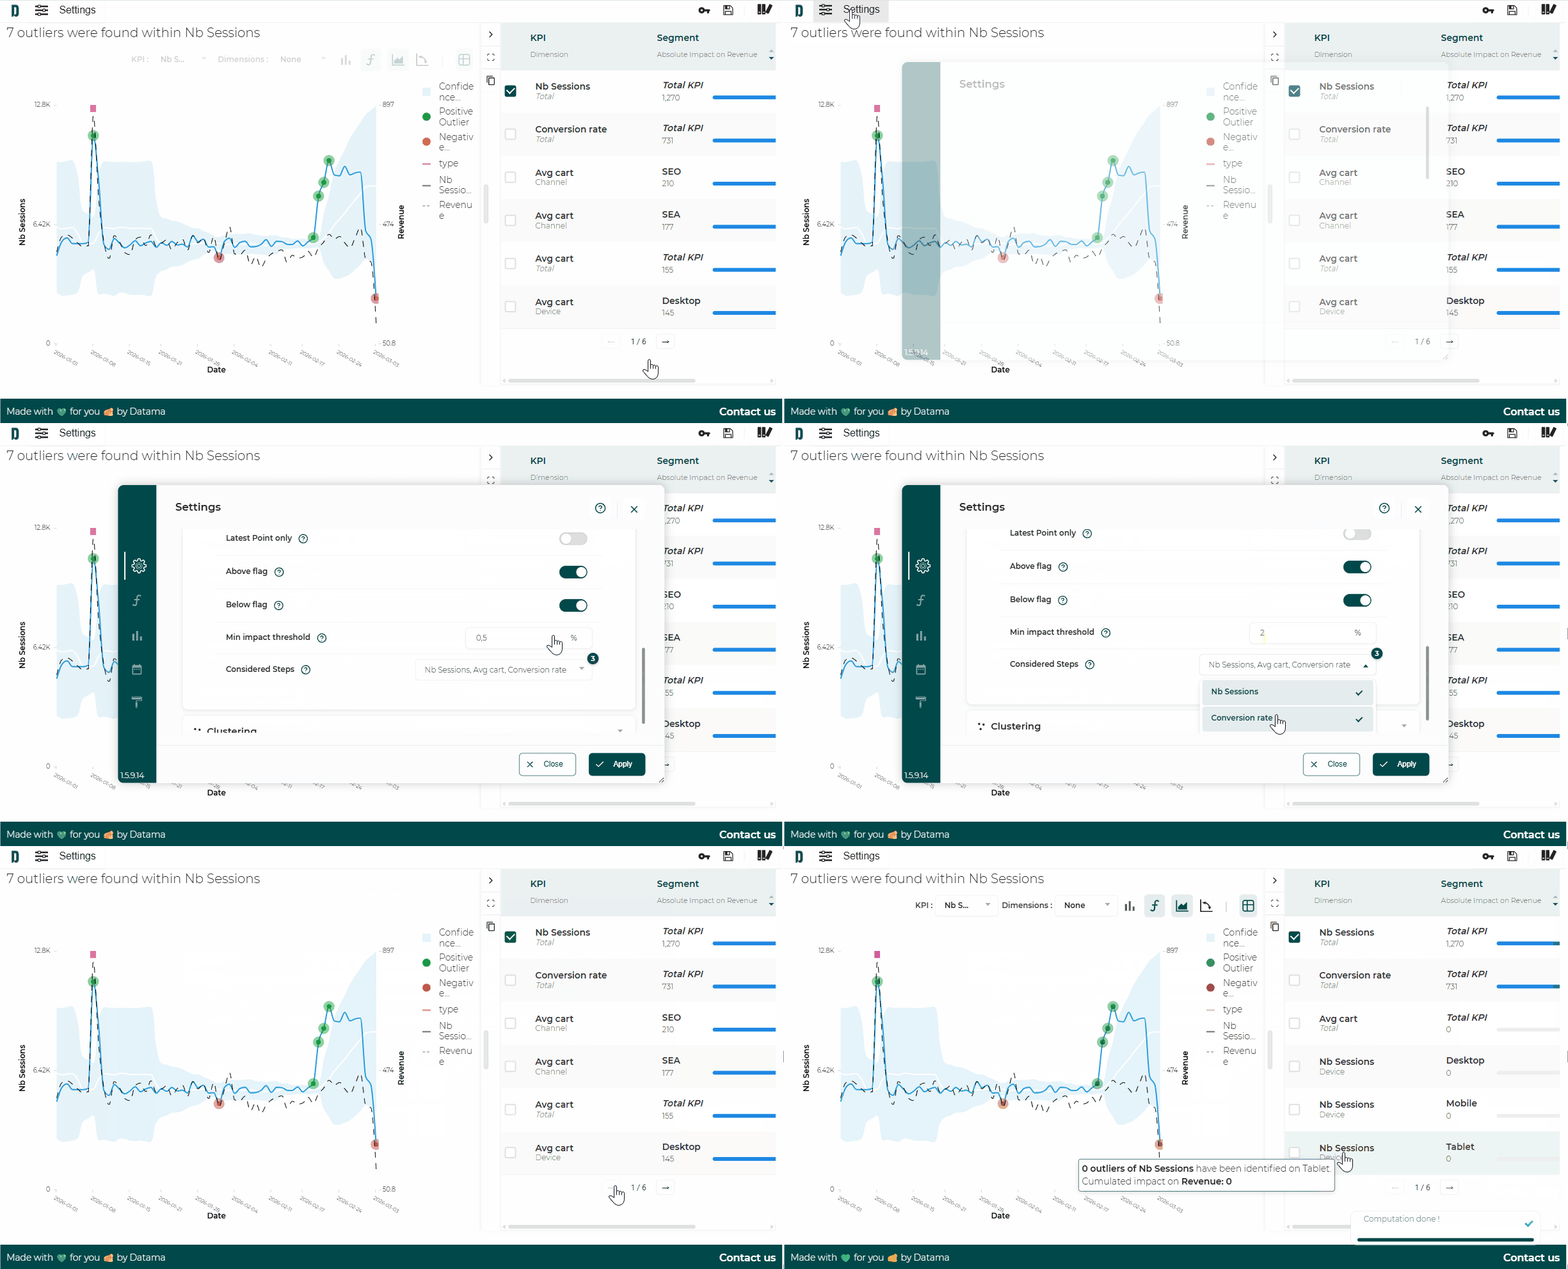
With the Extension Datama Detect, you can make anomaly detection smarter and more focused by setting a minimum impact threshold and choosing exactly which steps of your metrics relation can be reported as anomalies in the right panel where metrics/segments are ranked per impact on the main KPI.
In the “Settings” in the “Scope” section, you can define:
🎯 Last point only: analyse only the last point or all the available points (by default).
🚩 Above/ Bellow flag: choose to focus on positive or negative anomaly.
📊 Min impact threshold: ignore anomalies with too little impact on your global main KPI — set at 0.5% by default, and adjustable to focus on what truly matters.
⚙️ Considered Steps: keep all steps in your metrics relation, but exclude the ones that should not trigger alerts.
👉 You get the list of anomalies, prioritized by impact, exactly on the scope that matters for your business.
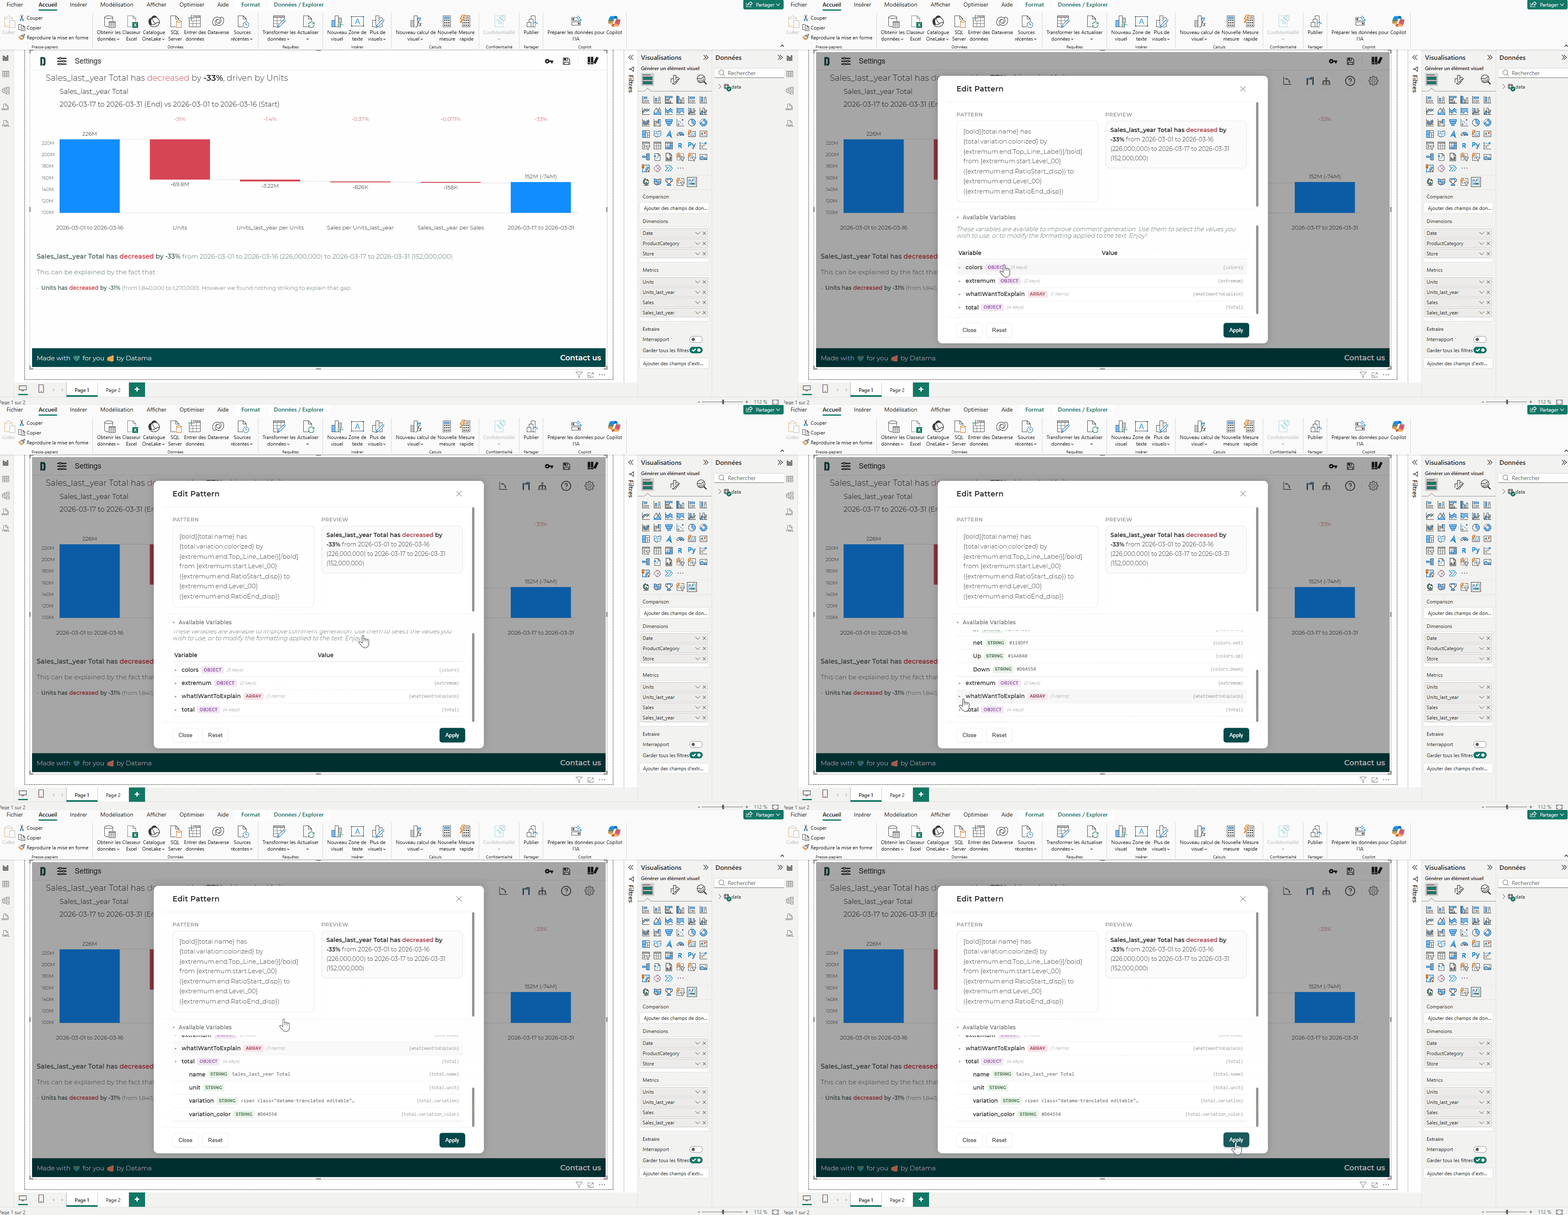
In Datama Light extensions, you can tailor the comments generated by Datama to perfectly match your tone and business needs using the “Edit sentence” feature (accessible via the “Edit template” pop-up window). This allows you to fully customize the wording of the analyses without altering the underlying analysis. ✍️
🧩 Tailor the wording: modify sentences to match your internal vocabulary or reporting style
🎯 Highlight what matters: emphasize specific dimensions (e.g., Channel, Region…) in your narrative
🔁 Use dynamic variables: leverage placeholders such as {step.name}, {step.variation}, or {list} to keep your insights automated while still being personalized
🎨 Control the formatting: add structure and clarity to make your insights easier to read and share
Does your margin analysis really give you the right answers?
Between the effects of volume, price, costs and product mix, in-house Excel models often end up creating more uncertainty than helping with decision-making. 🤨
Result: discrepancies that are difficult to reconcile and, at times, misguided corrective actions. ❌
Find out how an additive breakdown can precisely identify the drivers of margin variation in this article. 📖
An ideal use case for the Datama Excel add-in to share with the finance team. 🤓
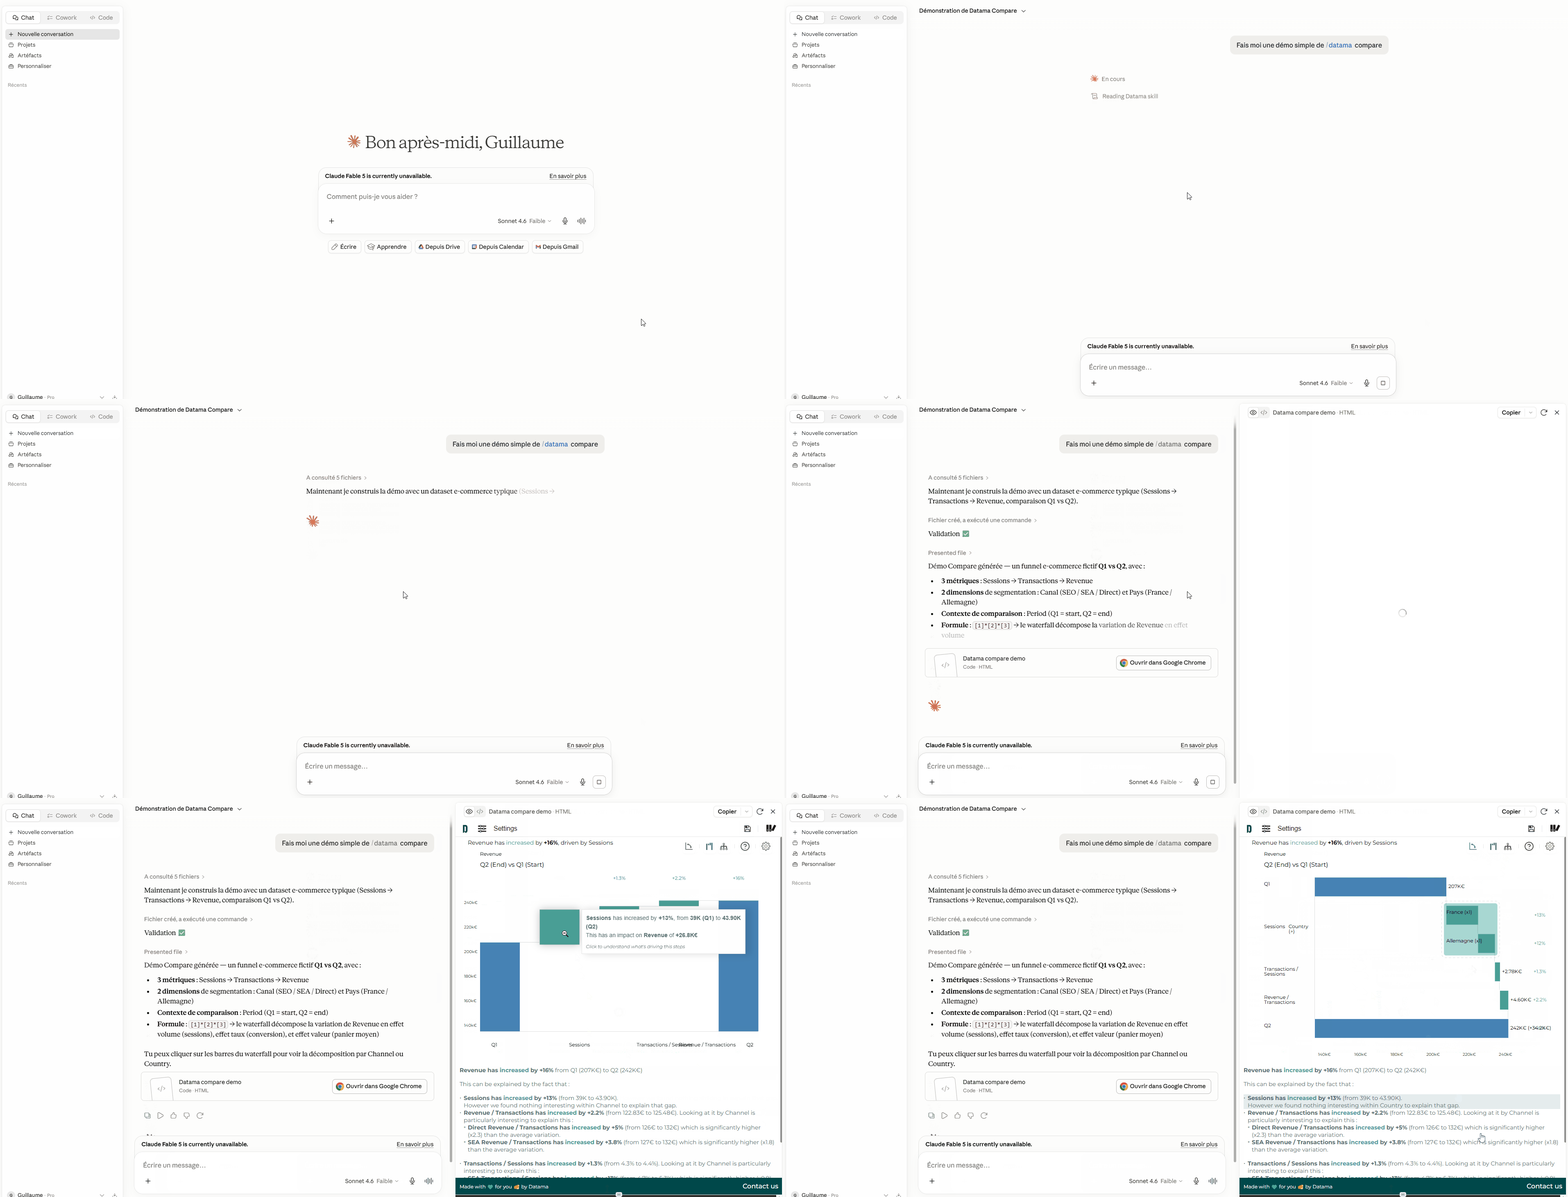
A big shift for anyone who already works with an AI assistant 🤓
You can now get a real Datama visualization — waterfall, breakdown, drill-down — delivered straight in the conversation 🎉
Ask a business question in plain language. When it’s relevant, your assistant doesn’t just answer in text: it renders Datama for you, interactively, in the chat.
“Why did revenue drop between Q1 and Q2?”
“Break down conversion by device and channel.”
“What drove the change in margin on mobile vs desktop?”
No switching tools. No rebuilding a chart by hand. The analysis shows up where you’re already thinking.
➡️ Why teams love it:
Stay in the flow: explore a KPI variation without leaving Claude, Cursor, ChatGPT, or your usual AI workspace.
Instant insight: a full interactive visualization — not a static screenshot — ready to open, share, or dig into.
Your data stays yours: everything runs in the browser; nothing is uploaded to Datama servers for rendering.
Install the Datama Skill once from your account, then just ask. The assistant knows when Datama is the right answer.
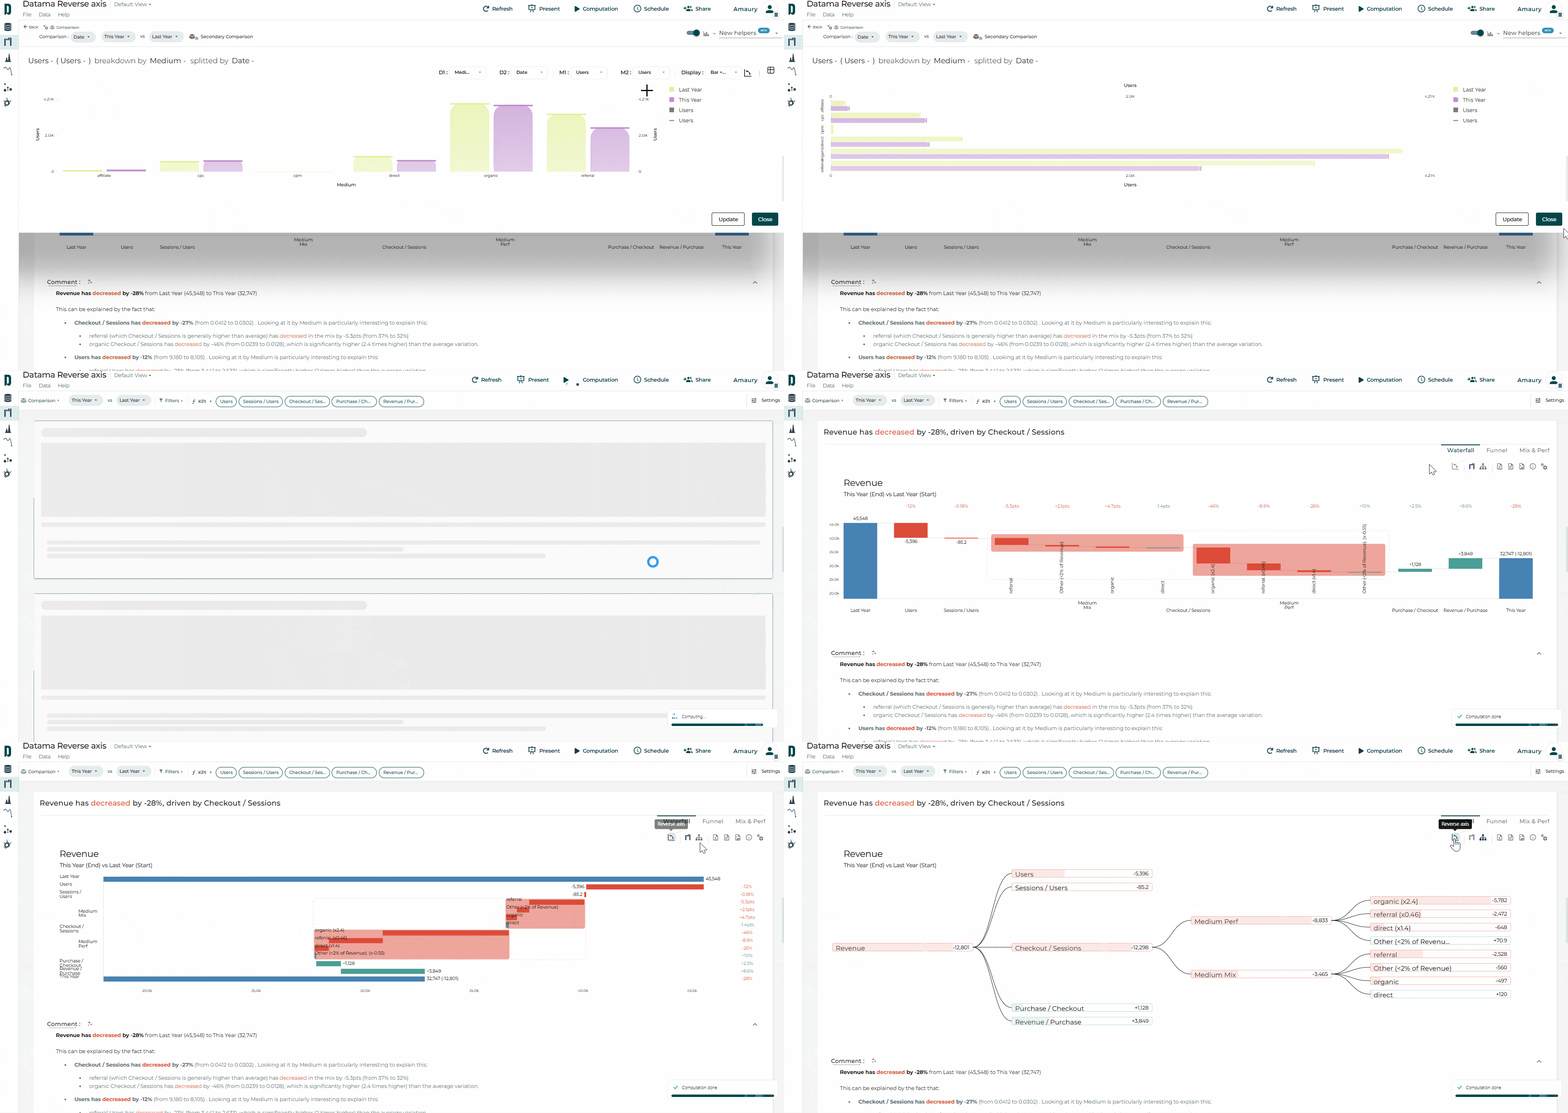
In Explore charts, Waterfalls or decision trees, do you sometimes struggle to find the most intuitive view for your audience, or are you limited by space on your dashboards?
👉 Try the “Reverse Axis” feature.
With a single click, it lets you switch from a horizontal view to a vertical one… and vice versa 😉
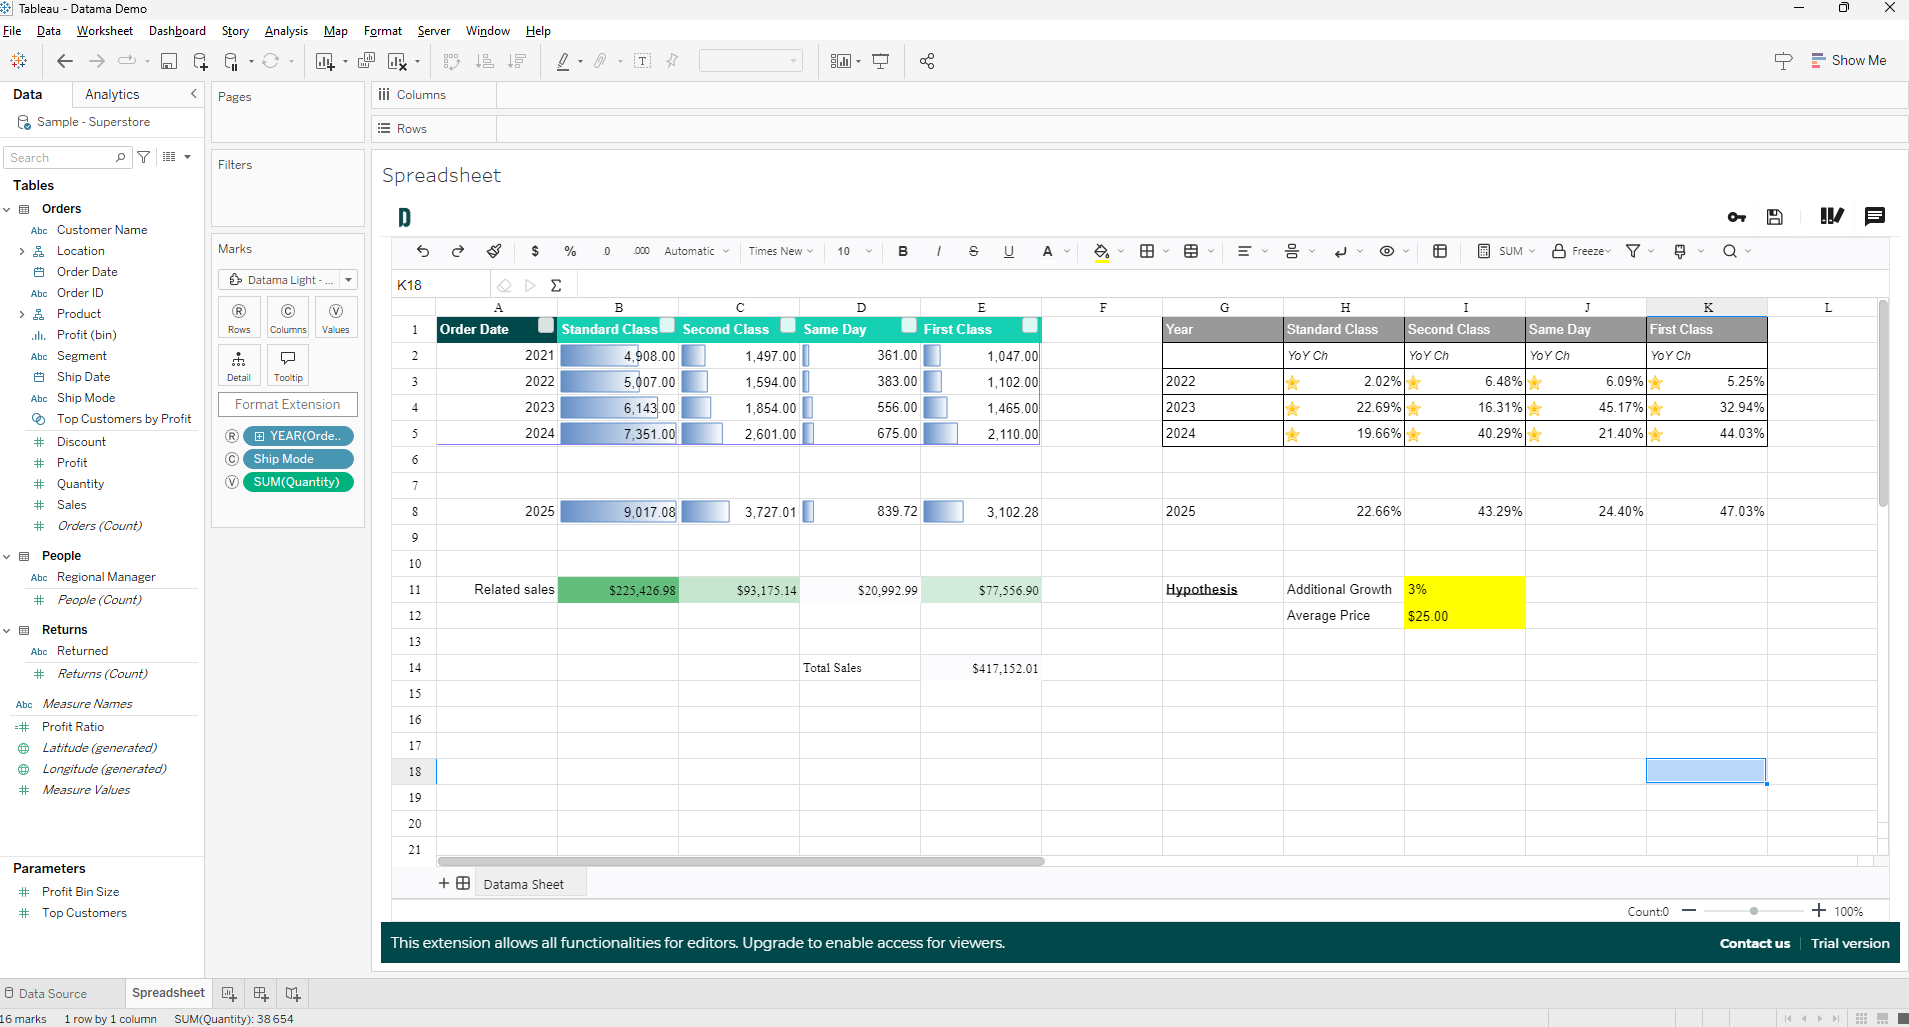
Use Datama Spreadsheet for Excel-like work on BI data
Despite years of beautiful dashboards and governed metrics, many teams still export to Excel for the last mile—formatting, ad hoc layout, and cell formulas that never quite fit in SQL or the BI calculation layer. Datama Spreadsheet leans into that habit: it gives you an Excel-like interface inside the BI tool, so you stay in context while you work the grid.
What it is: pivot-style mapping (Rows, Columns, Values) plus spreadsheet features (formatting, filters, functions). Built on the open-source Luckysheet project.
Licensing: the extension is available to all for free. For Tableau and Power BI, you still need an extension licence aligned with your contract so viewers can access the visual.
Where it runs: light extension in Tableau, Power BI, Qlik, and Looker Studio (not in Google Sheets or Excel, obviously!).
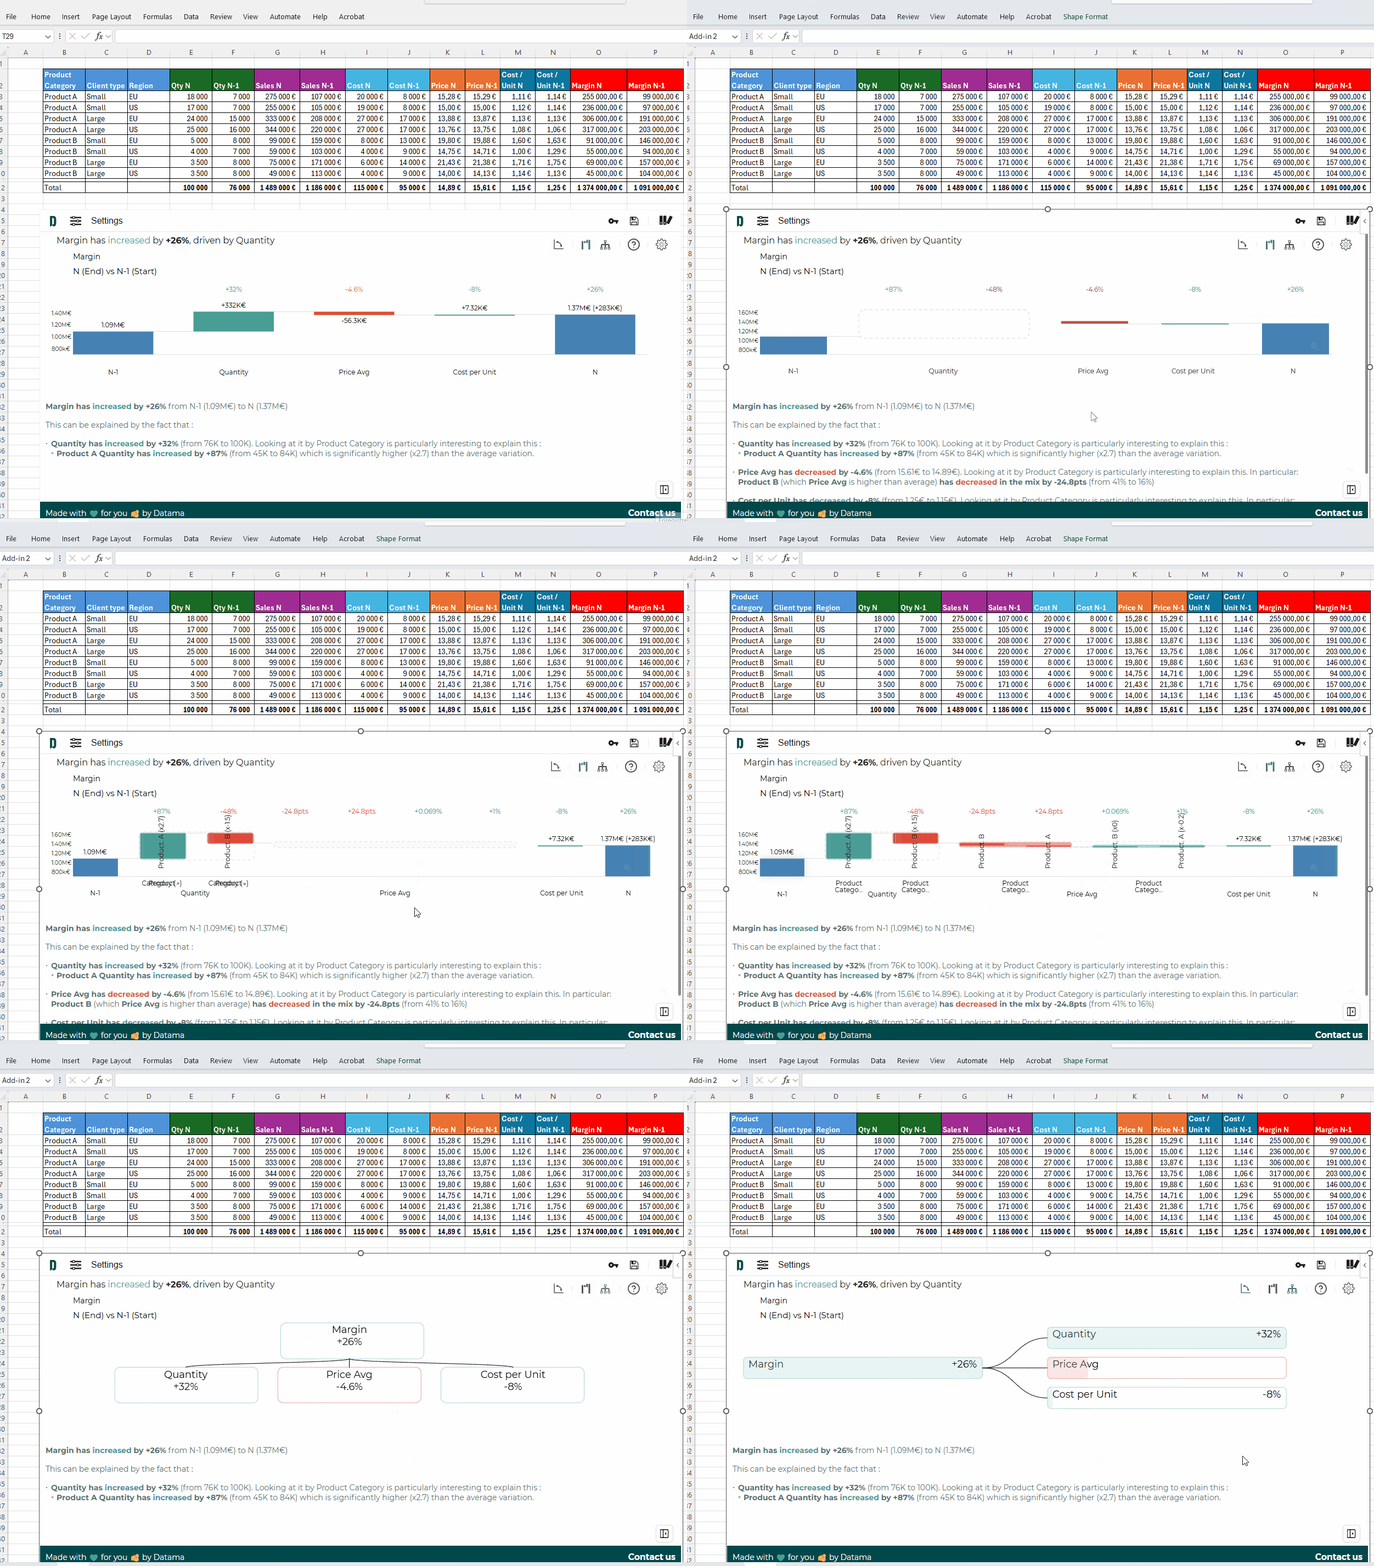
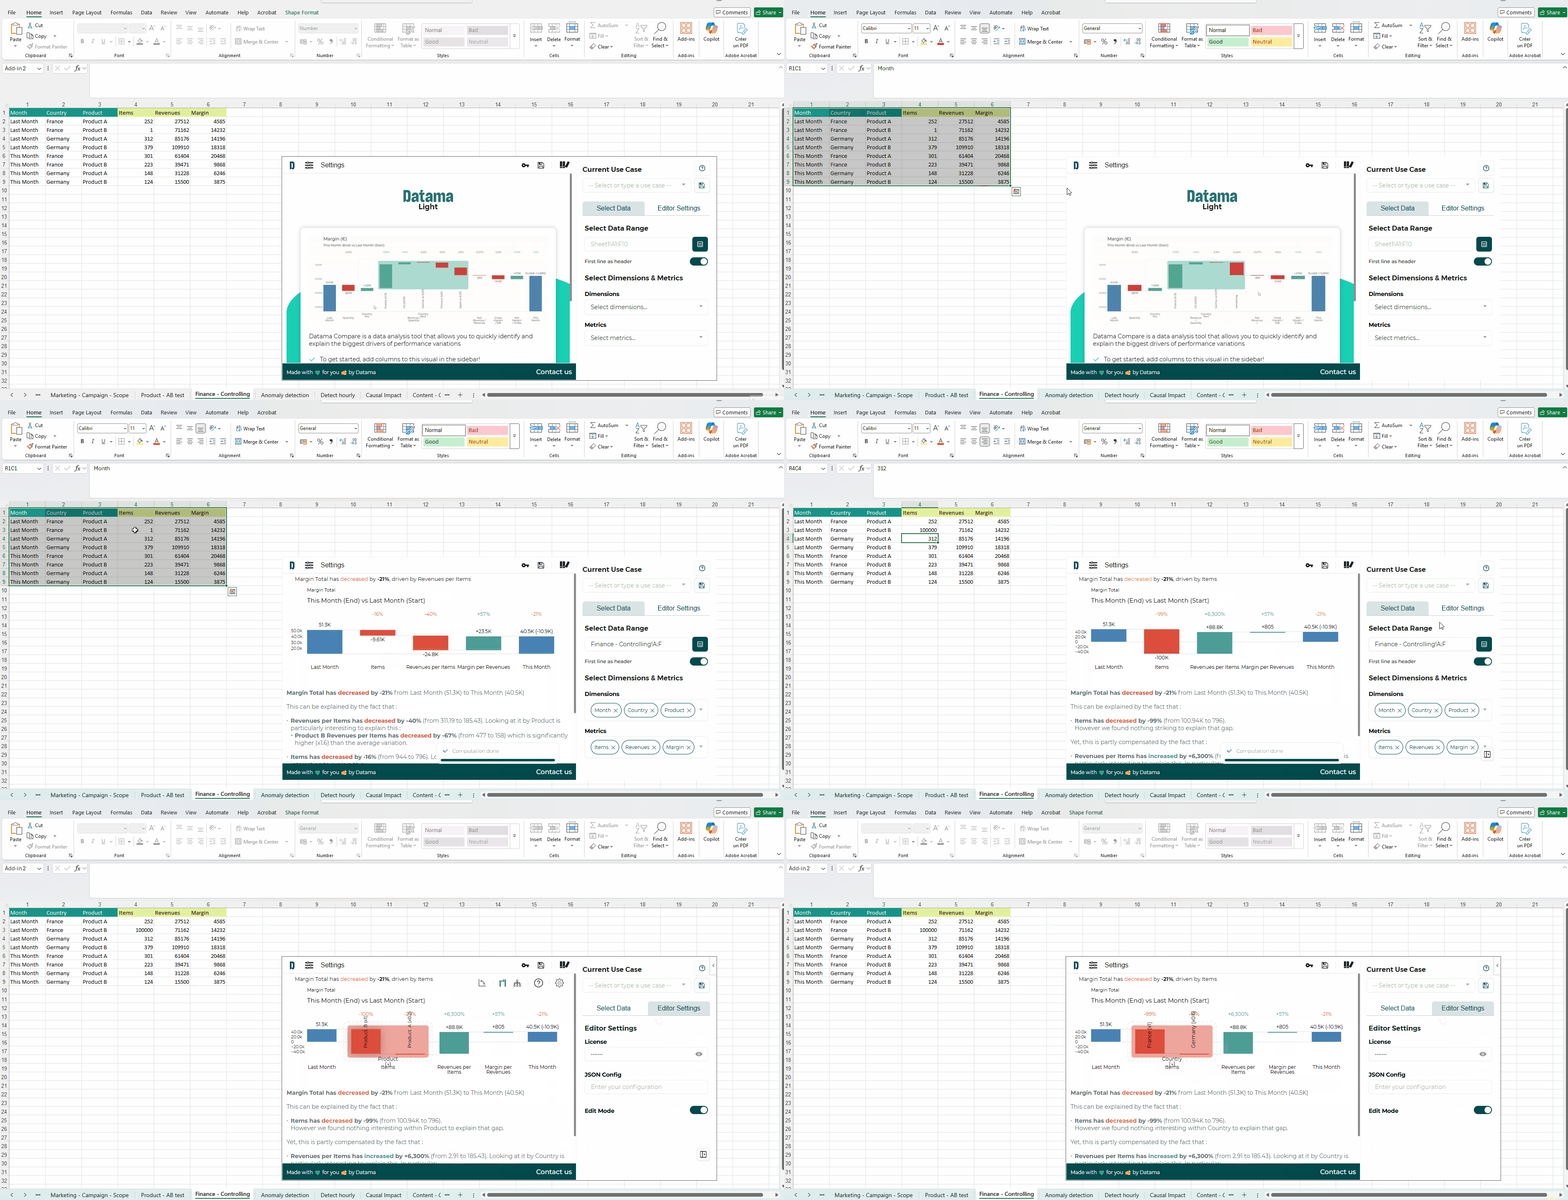
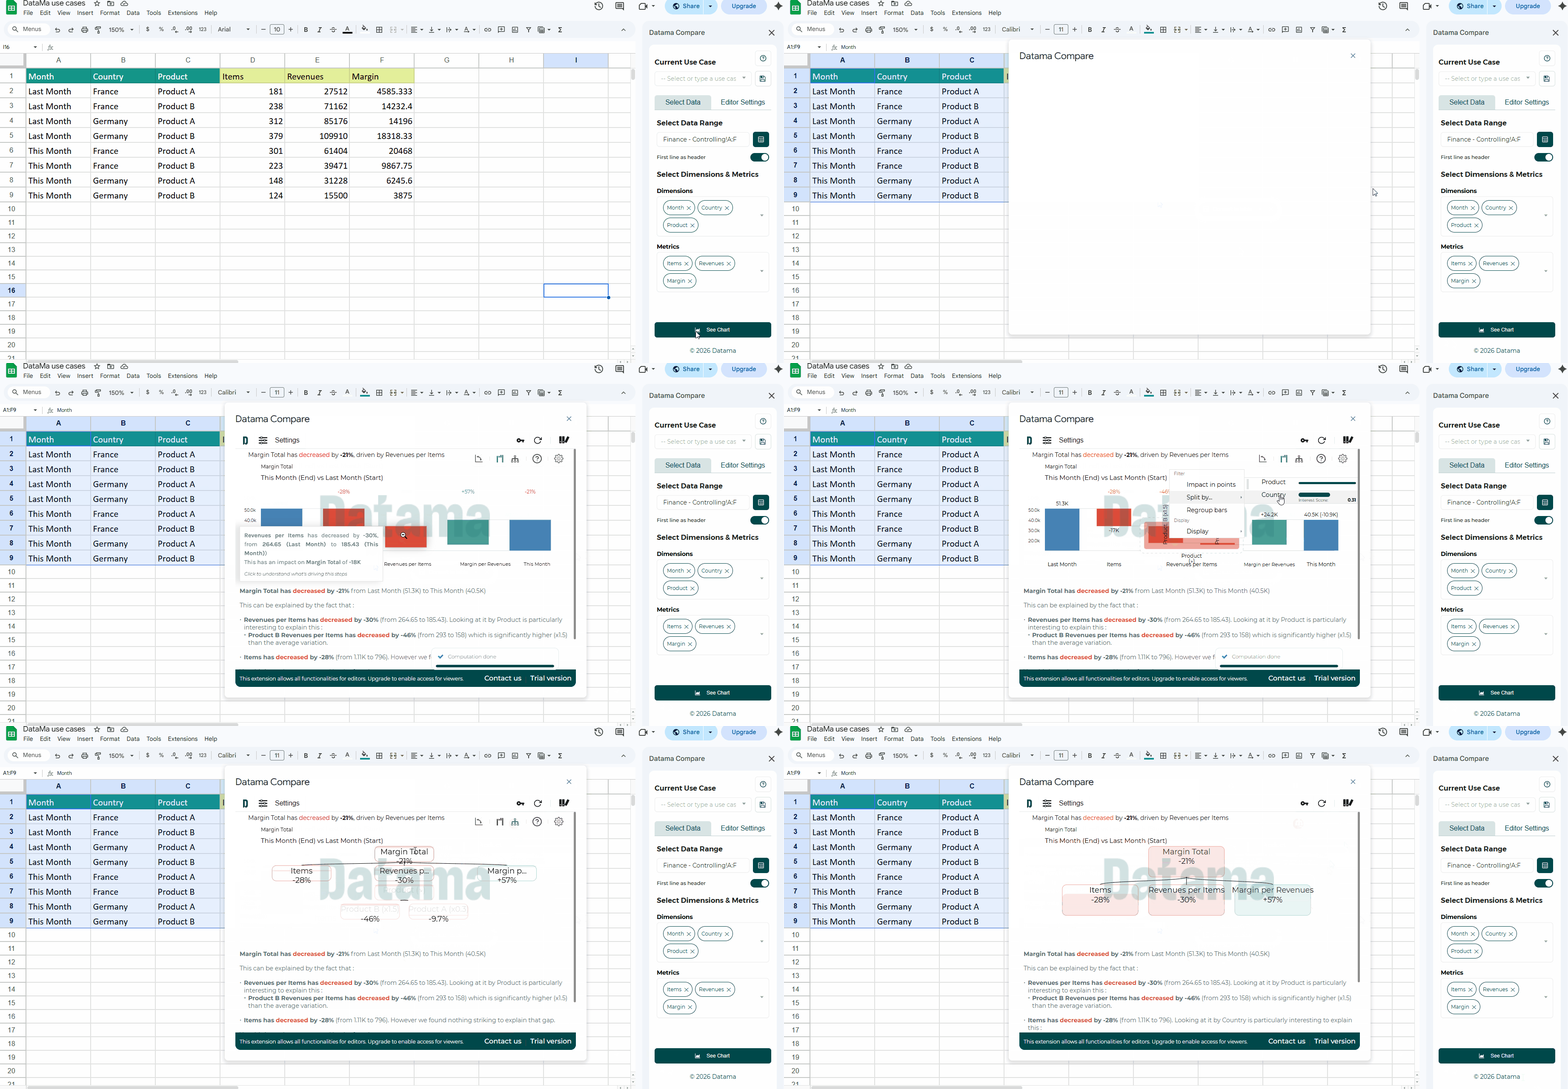
You can use Datama Compare directly in your workbook 🎉
Install from the Microsoft AppSource listing, or in Excel go to Home > Add-ins and search for Datama Compare (if your Microsoft 365 is managed by your organization, an admin may need to allow the add-in first).
Prepare an aggregated table (KPI, comparison dimension, steps, explanation dimensions)—same logic as in our other Compare extensions.
Open the add-in task pane, select your data range, adjust dimensions and metrics if needed, then run the analysis.
Optional: start a paid trial from the footer to unlock branding removal and saved settings; paste your licence key under Editor Settings as described in the docs.
➡️ Why teams like it:
Stay in the grid: explain variations where the data already lives—no copy-paste into another tool.
Live what-if feel: change numbers or scenarios in the sheet and re-read impact on the waterfall and tree as you usually iterate in Excel.
Full Compare toolkit: waterfall and performance tree, smart scoring, mix effect, intelligent comments, and interactive drill-down.
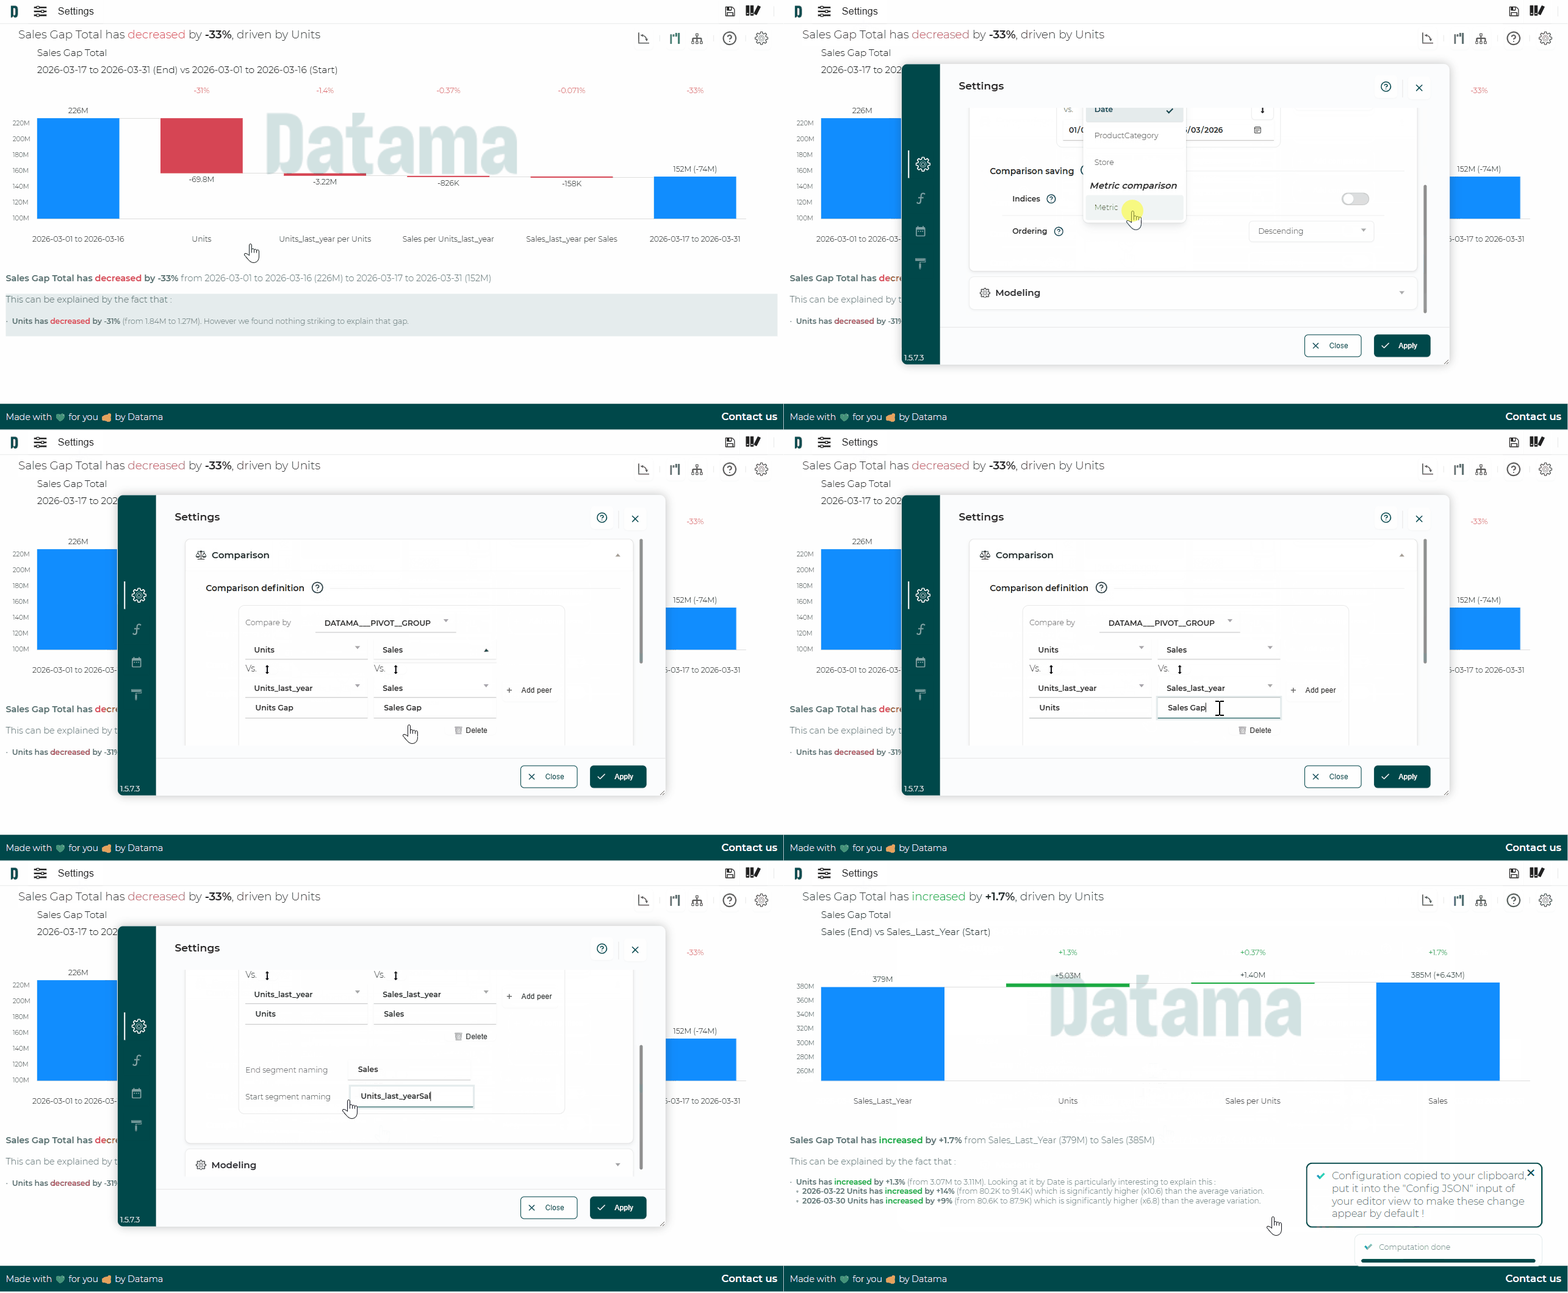
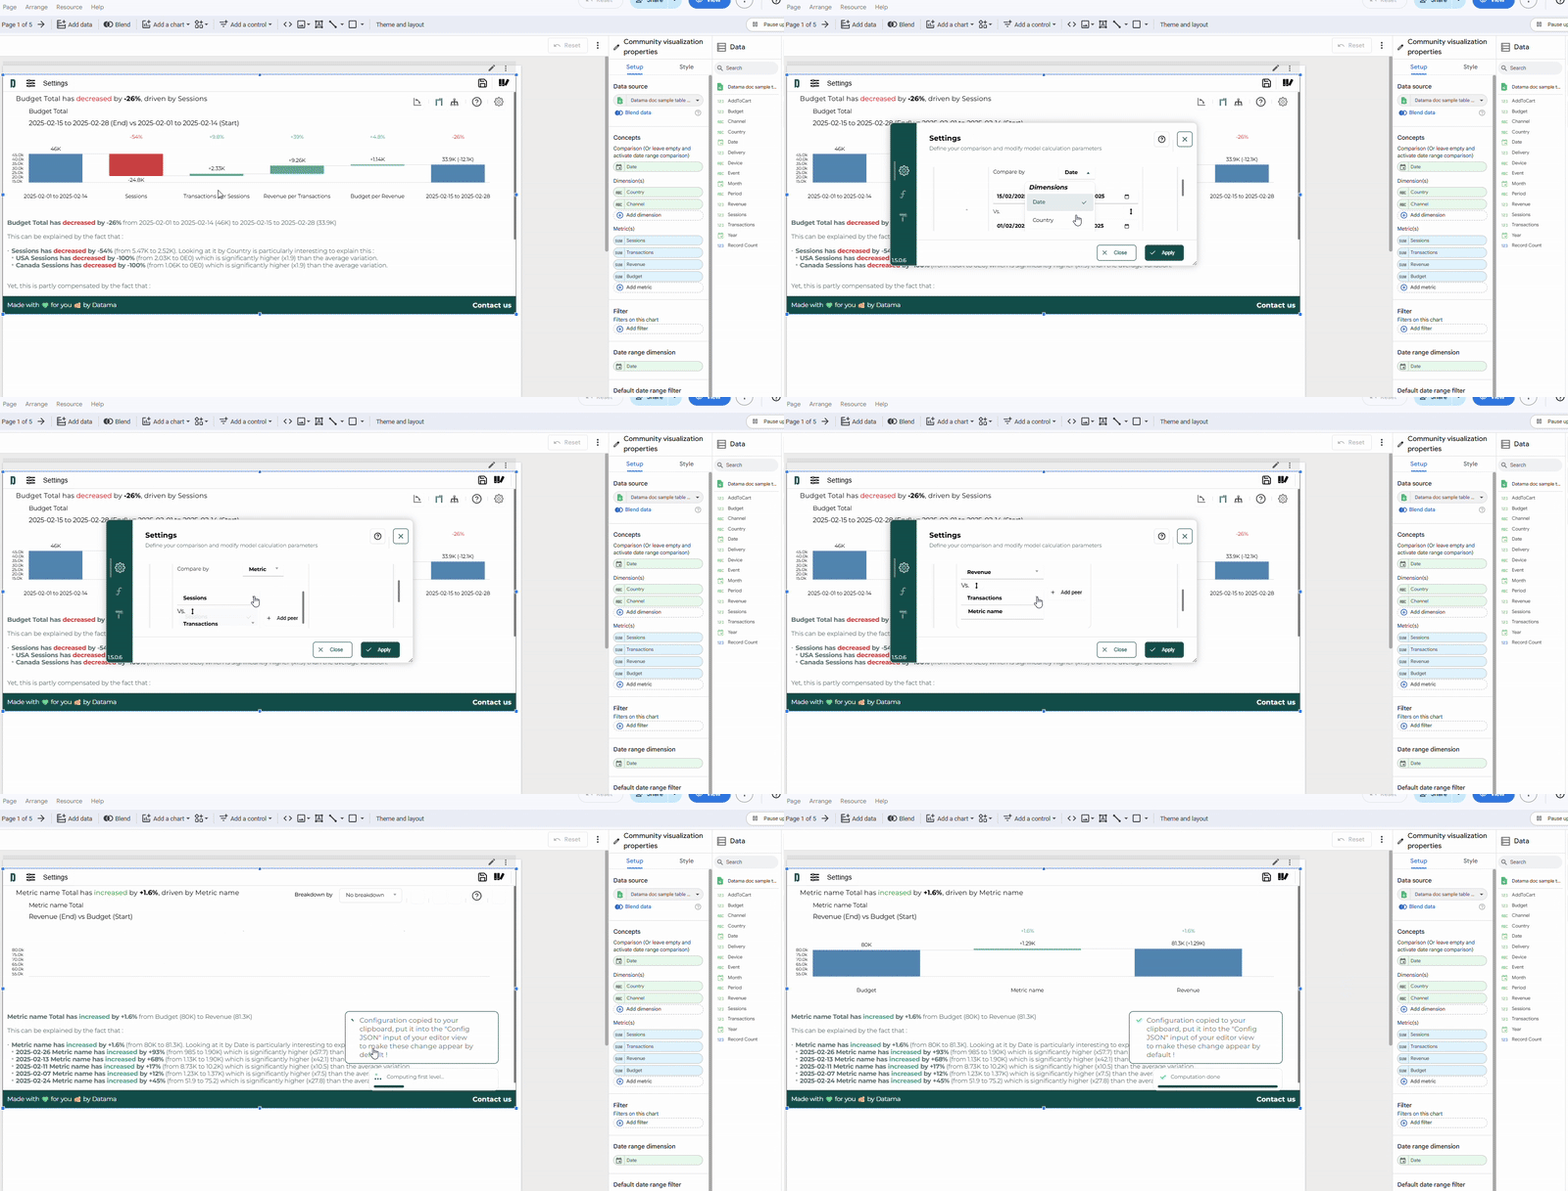
Do you have pairs of metrics in your dataset (e.g., Sales and Sales N-1, Units and Units N-1)?
👉 ‘Compare by Metric’ is perfectly suited for this use case. It allows you to directly compare these metrics with each other and explain variations in a KPI without relying on a simple time-series comparison.
⚙️ To enable it:
Go to settings
Select Compare by “metric”
Then select the currency pairs in the order specified in your market equation
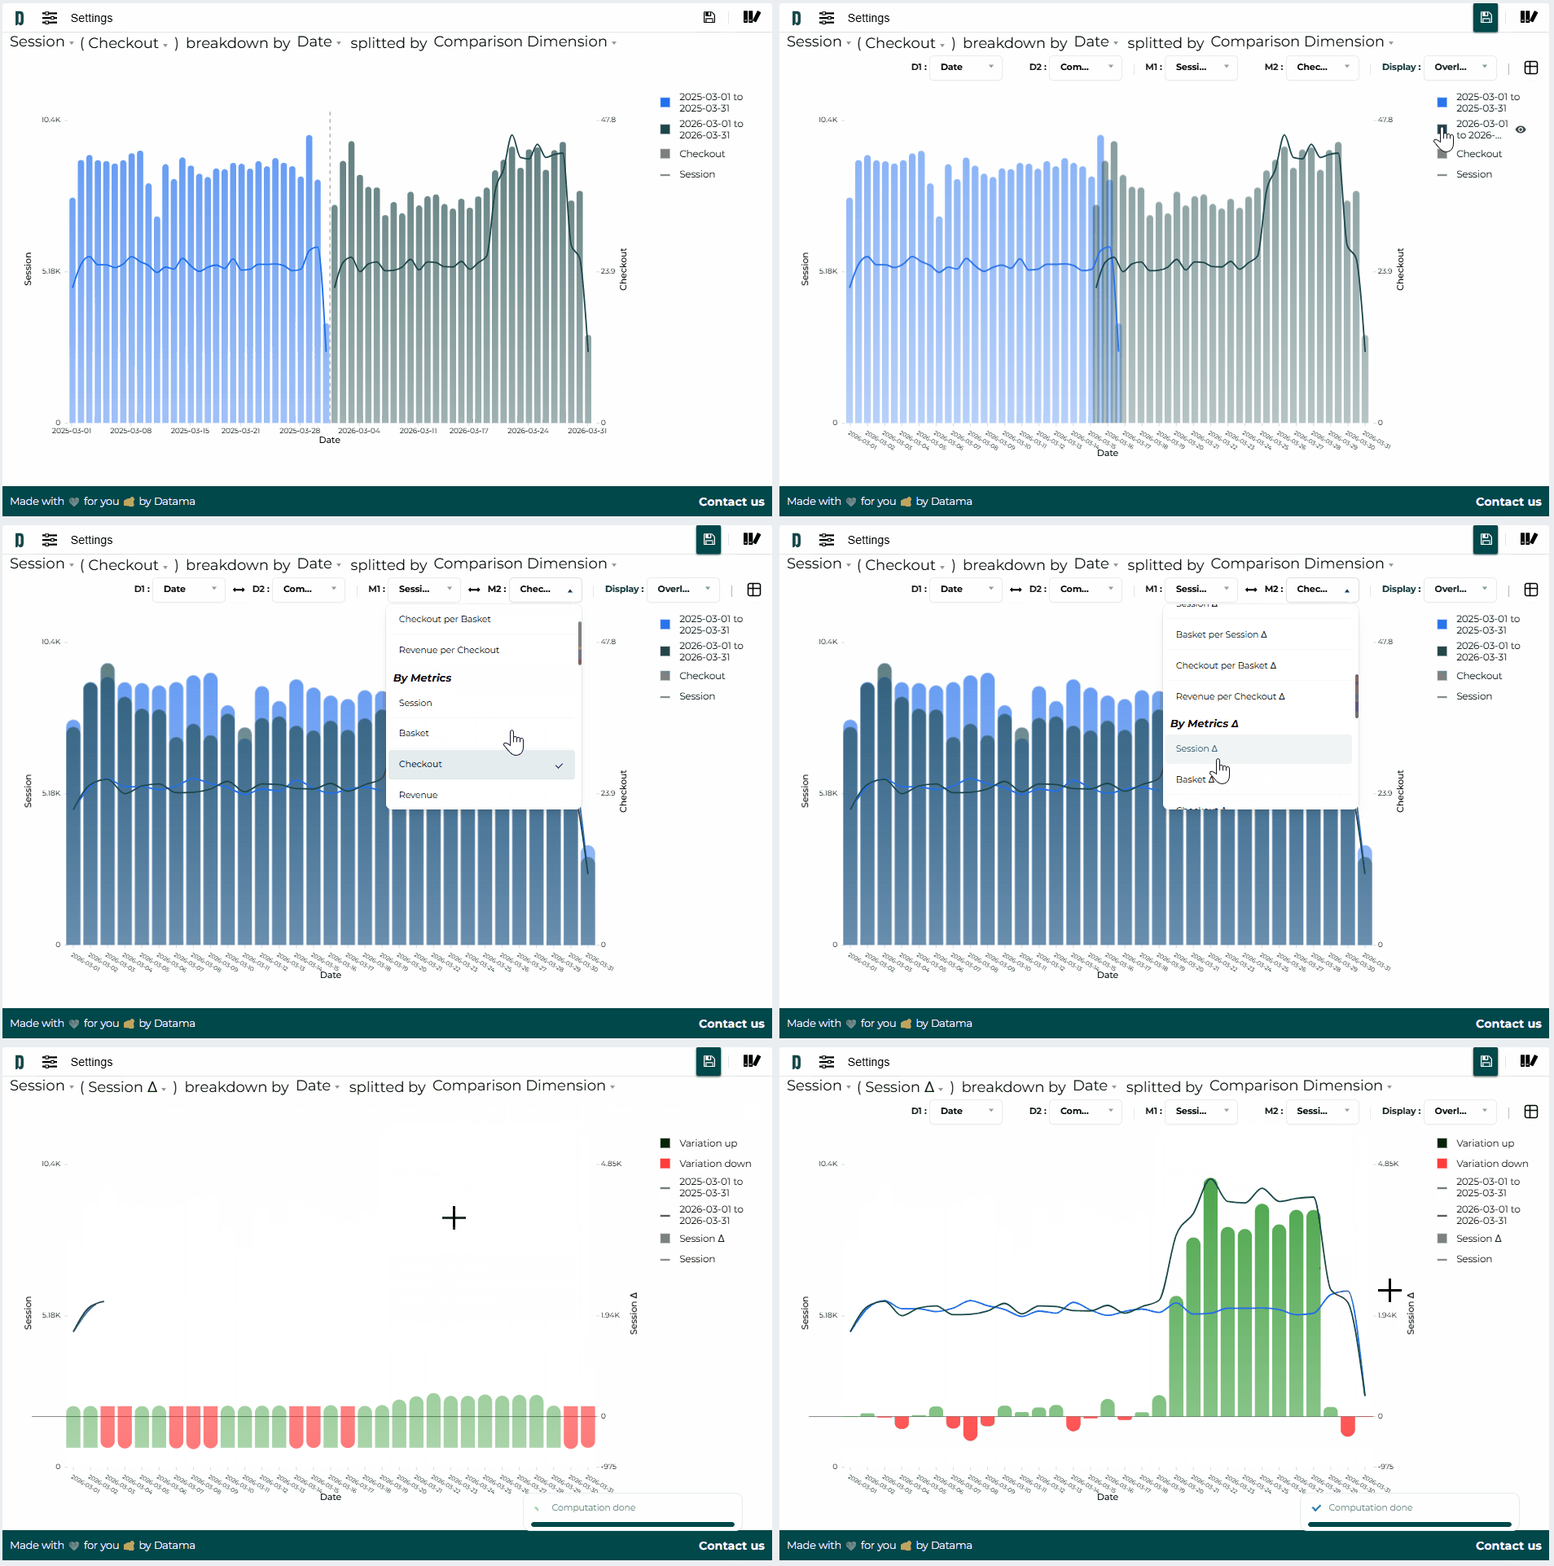
With the “Overlay” feature in Datama Explore, display your chart as an overlay to get a clear view of the variations in your KPIs based on the dimensions shown.
For example, when comparing:
dates, you’ll see periods with significant variations 🗓️
other dimensions, you’ll identify the segments that have varied the most in your comparison 📈
➕ New metrics are available for this visualization, including absolute and relative variations of your indicators.
At certain steps of your market equation, you may want to:
focus primarily on breaking down that step by a specific dimension 🔍
or exclude a dimension that isn’t relevant to a given step 🔻
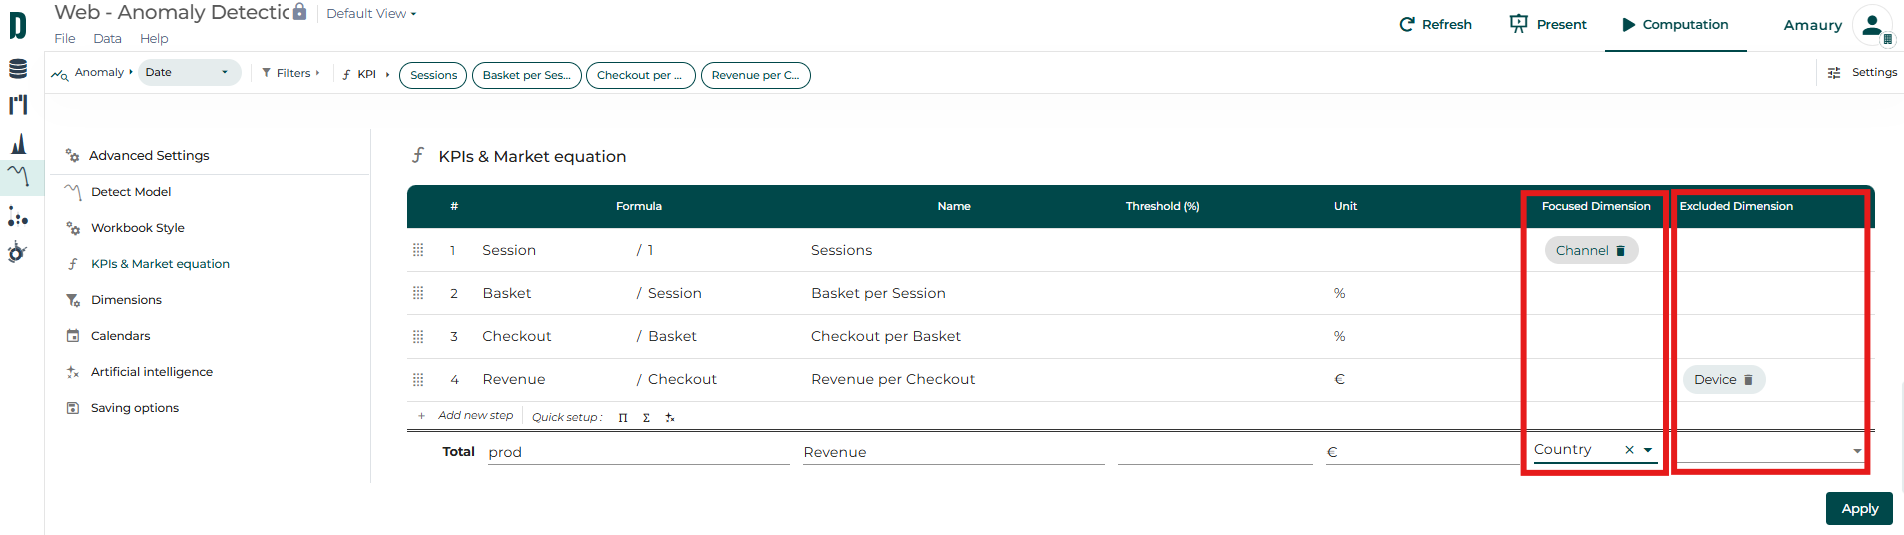
You can do this in the market equation menu by adding the dimension in question to the corresponding “Focused Dimension” or “Excluded Dimension” column 🤓
Note: For the main KPI, this prioritization or exclusion has an impact in “Dimension then step” mode 😉
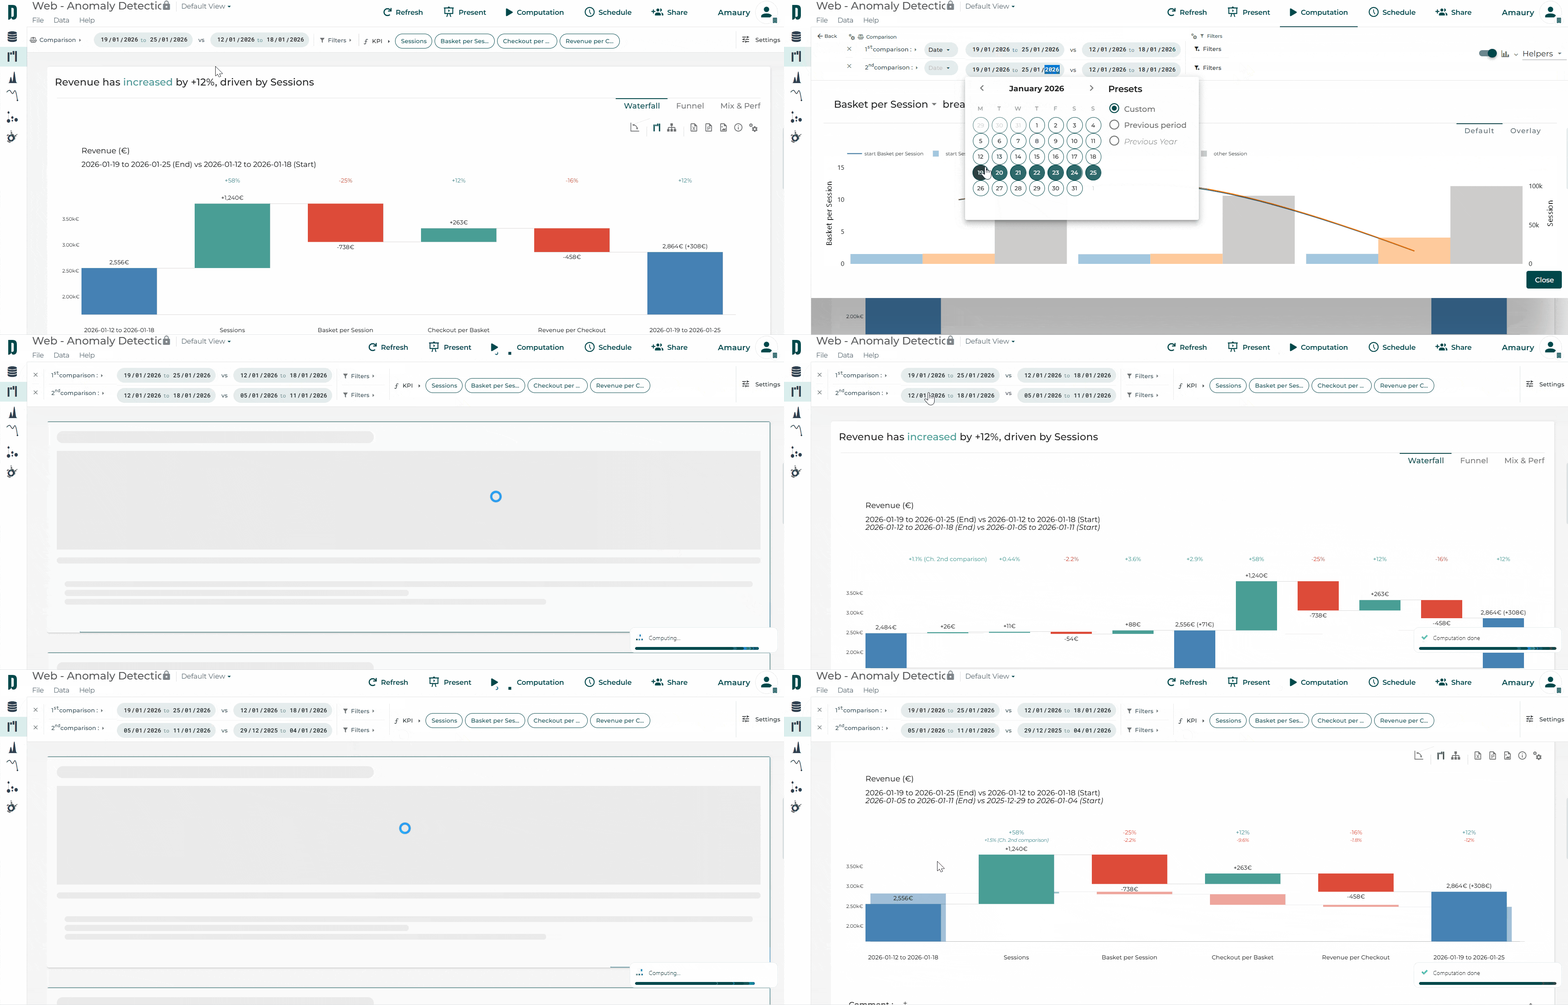
In Datama Compare, you can activate a second comparison. This allows you to display, in the background of your waterfall chart, the variations of another comparison or, if the periods are successive (comparison of period A to B and B to C), it will be displayed as two successive waterfall charts. 🤓
Ideal for highlighting your current results by comparing them, for example, to the same period last year… 📊
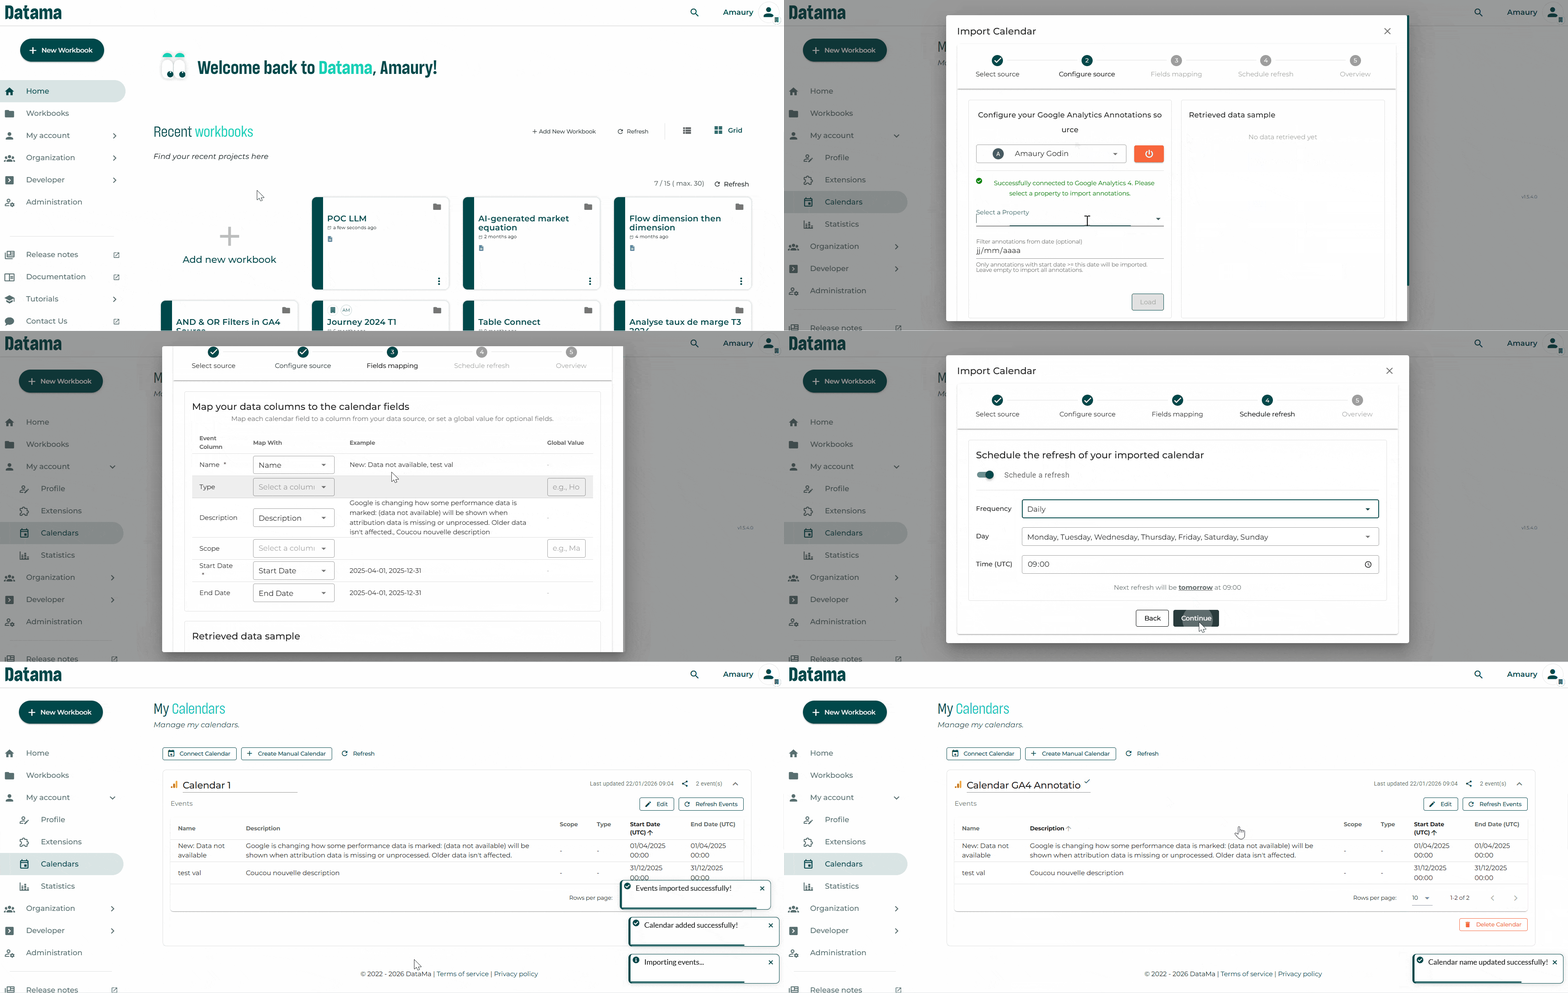
When detecting anomalies and explaining variations, behind the data correlations that Datama helps you find, there are often more “qualitative” or “contextual” root causes for changes in performance. Holidays, campaigns, product launches, incidents, etc. all have an impact on indicators, but they are rarely taken into account in the analysis. 🗓️
With Datama Calendar, you can easily add business events (internal and external) to your dashboards and instantly visualize their impact on your KPIs. 📊
Calendars are coming to Datama and will become a key tool for better understanding your performance by integrating events 🎇🎆
You can now create or connect calendars from different sources (Google Sheets™, Google Calendar, BigQuery, Excel, etc.) and synchronize them automatically.
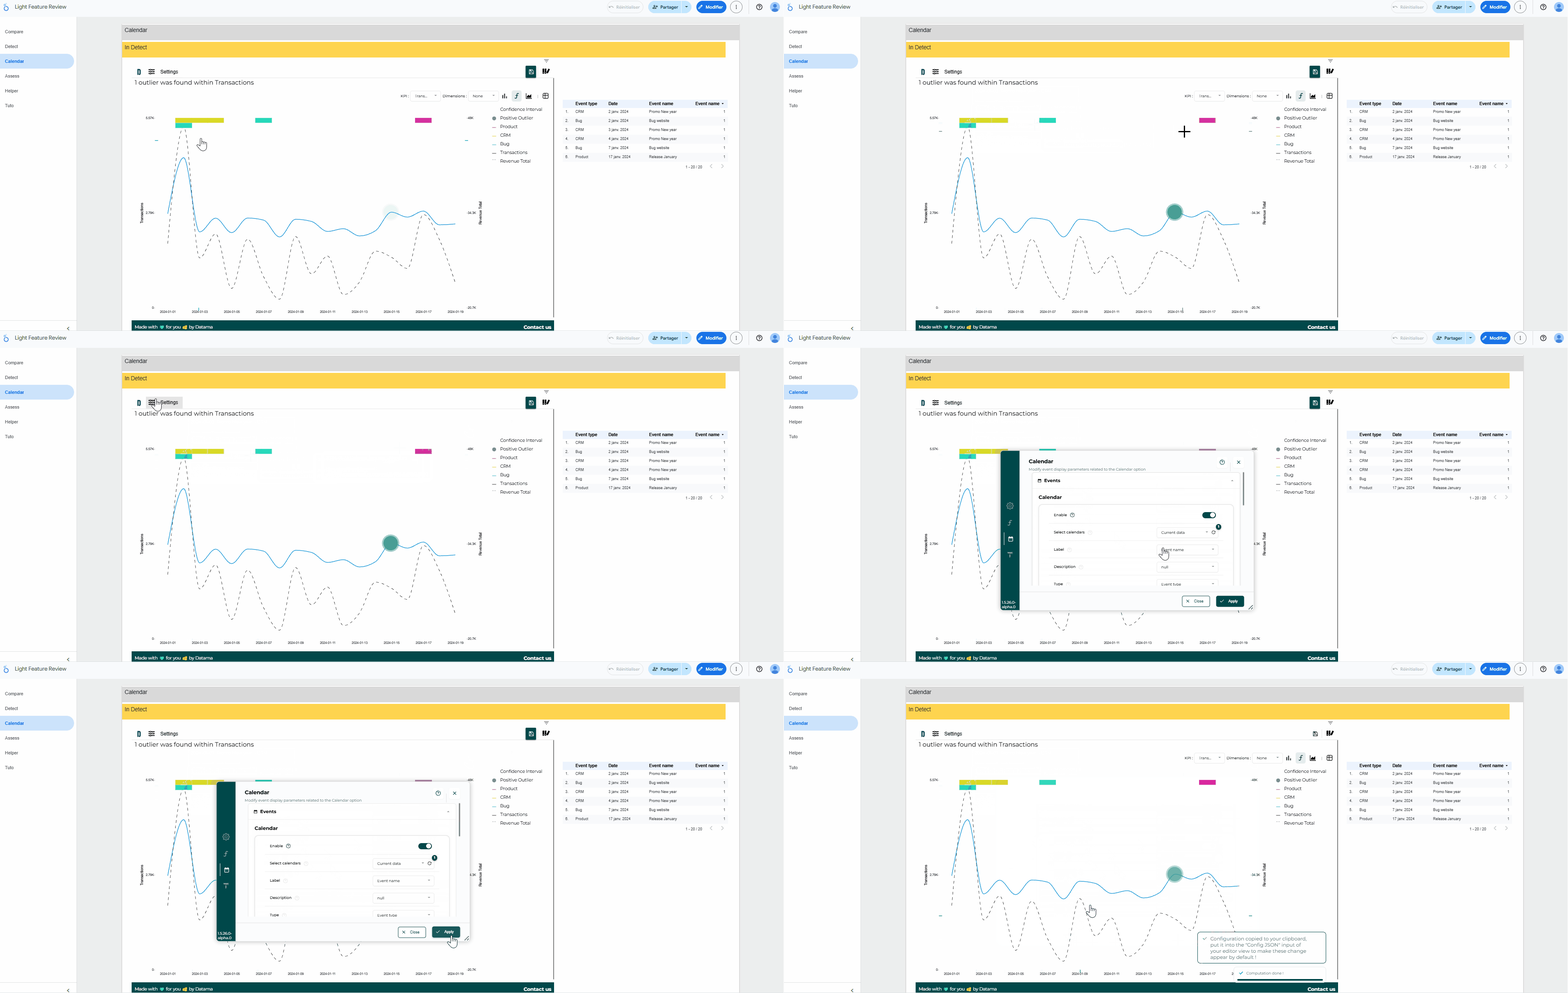
By connecting them to your workbooks, you can find your events in:
the Helpers 📊
the enhanced comments 📰
the Light extensions on Detect and Explore 📉
Bonus: from Tableau, Power BI, or Qlik, you can create an event with a simple right-click. Datama thus becomes your central repository for key events. 📅
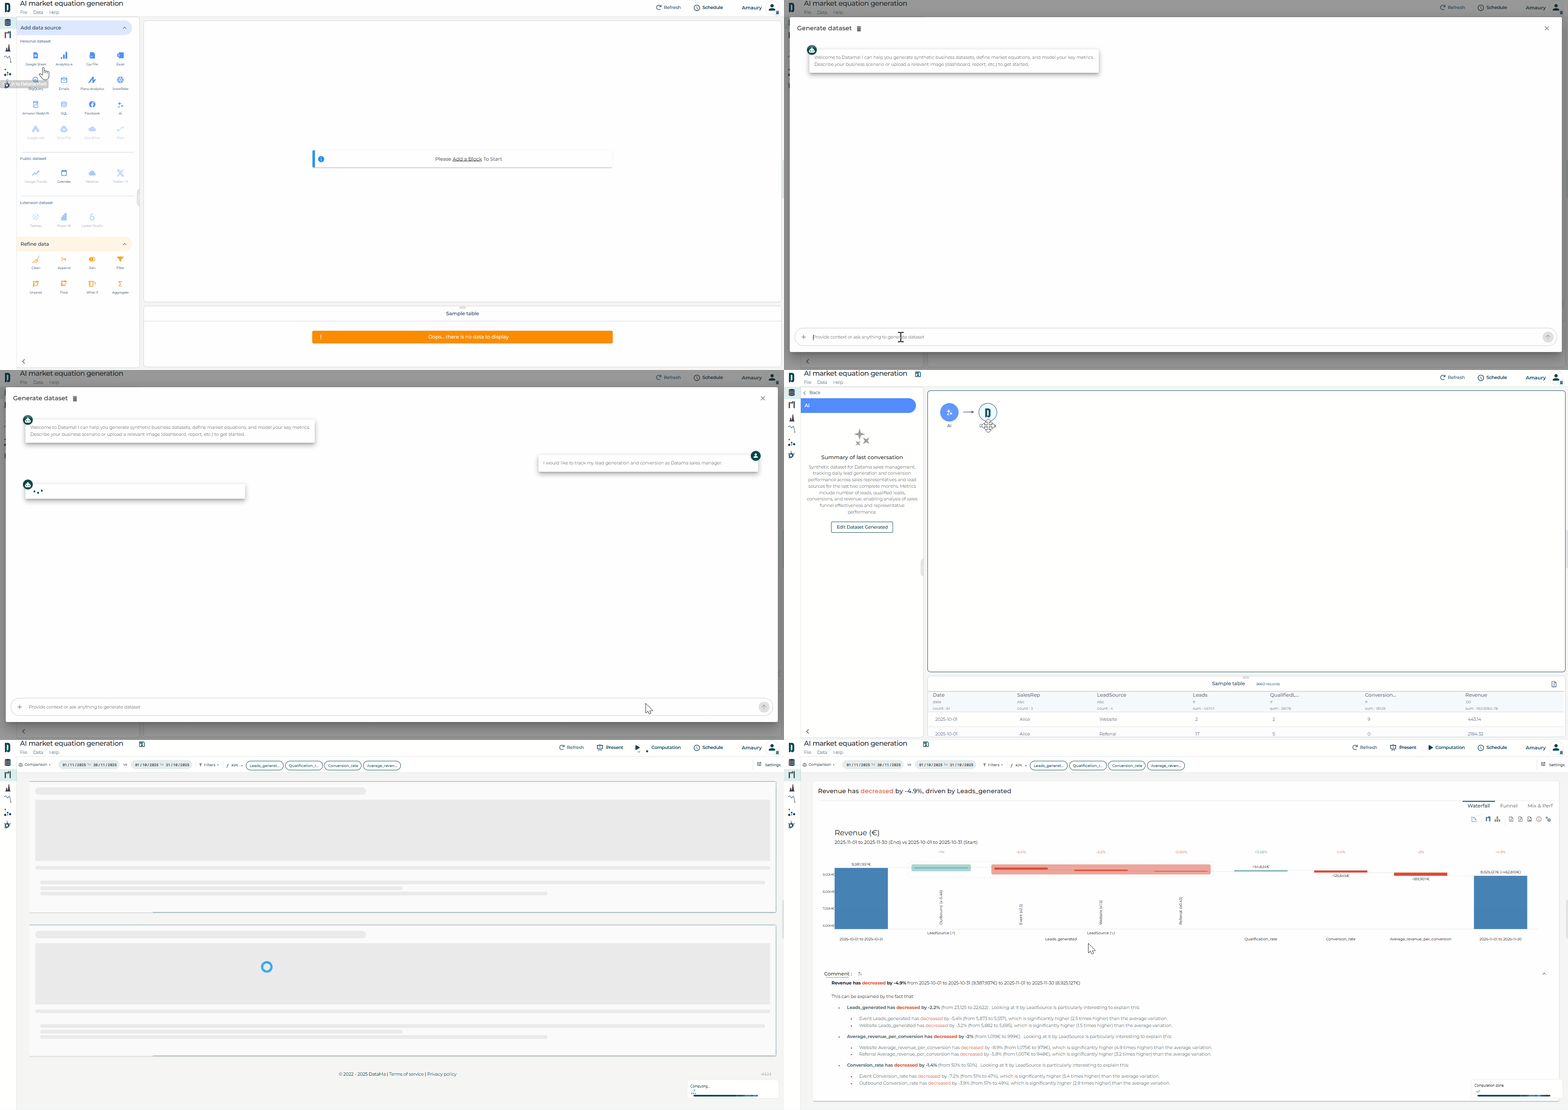
You can now generate a synthetic dataset simply by describing your use case via a prompt. In a matter of seconds, a complete dataset is created… along with the associated market equation
This breakthrough is ideal for prototyping and testing ideas 💡 without the need for real data.
Simply select the block ✨ in Datama Prep, describe your needs, validate the equation, and then generate your use case 🎯
This saves time for brainstorming and experimenting! 🧪
Good news for all Datama clients! We’ve launched—now in beta—the new Datama Explore (aka Helper), available on Datama Web and as an extension to anyone with a Datama licence.
This extension streamlines your setup while enriching your analytical capabilities with:
Self-service flexibility ⚙️
Instantly select any dimension, metric (Market Equation), and visualization type—no need to pre-build complex parameters in your BI tool.
Instant variation analysis 📈
Define comparisons on the fly to automatically generate Δ and % Change metrics across all KPIs.
Advanced charts 📊
Leverage exclusive visuals such as Moves (to understand mix effects) and Mekko (to explore size and composition) for deeper insights.
With a single click from the output block in Prep, AI now suggests a market equation based solely on the names of your columns and any optional context you provide (to specify the currency, for example, or the analysis you want to perform).
No data from your dataset is shared—only metadata (column name and data type, e.g., string, float, date, etc.)—to ensure complete confidentiality 🔒
You can use your own OpenAI key to maintain control over the license 🔑
A first step towards integrating LLMs into data preparation and analysis…more to come soon 🚀
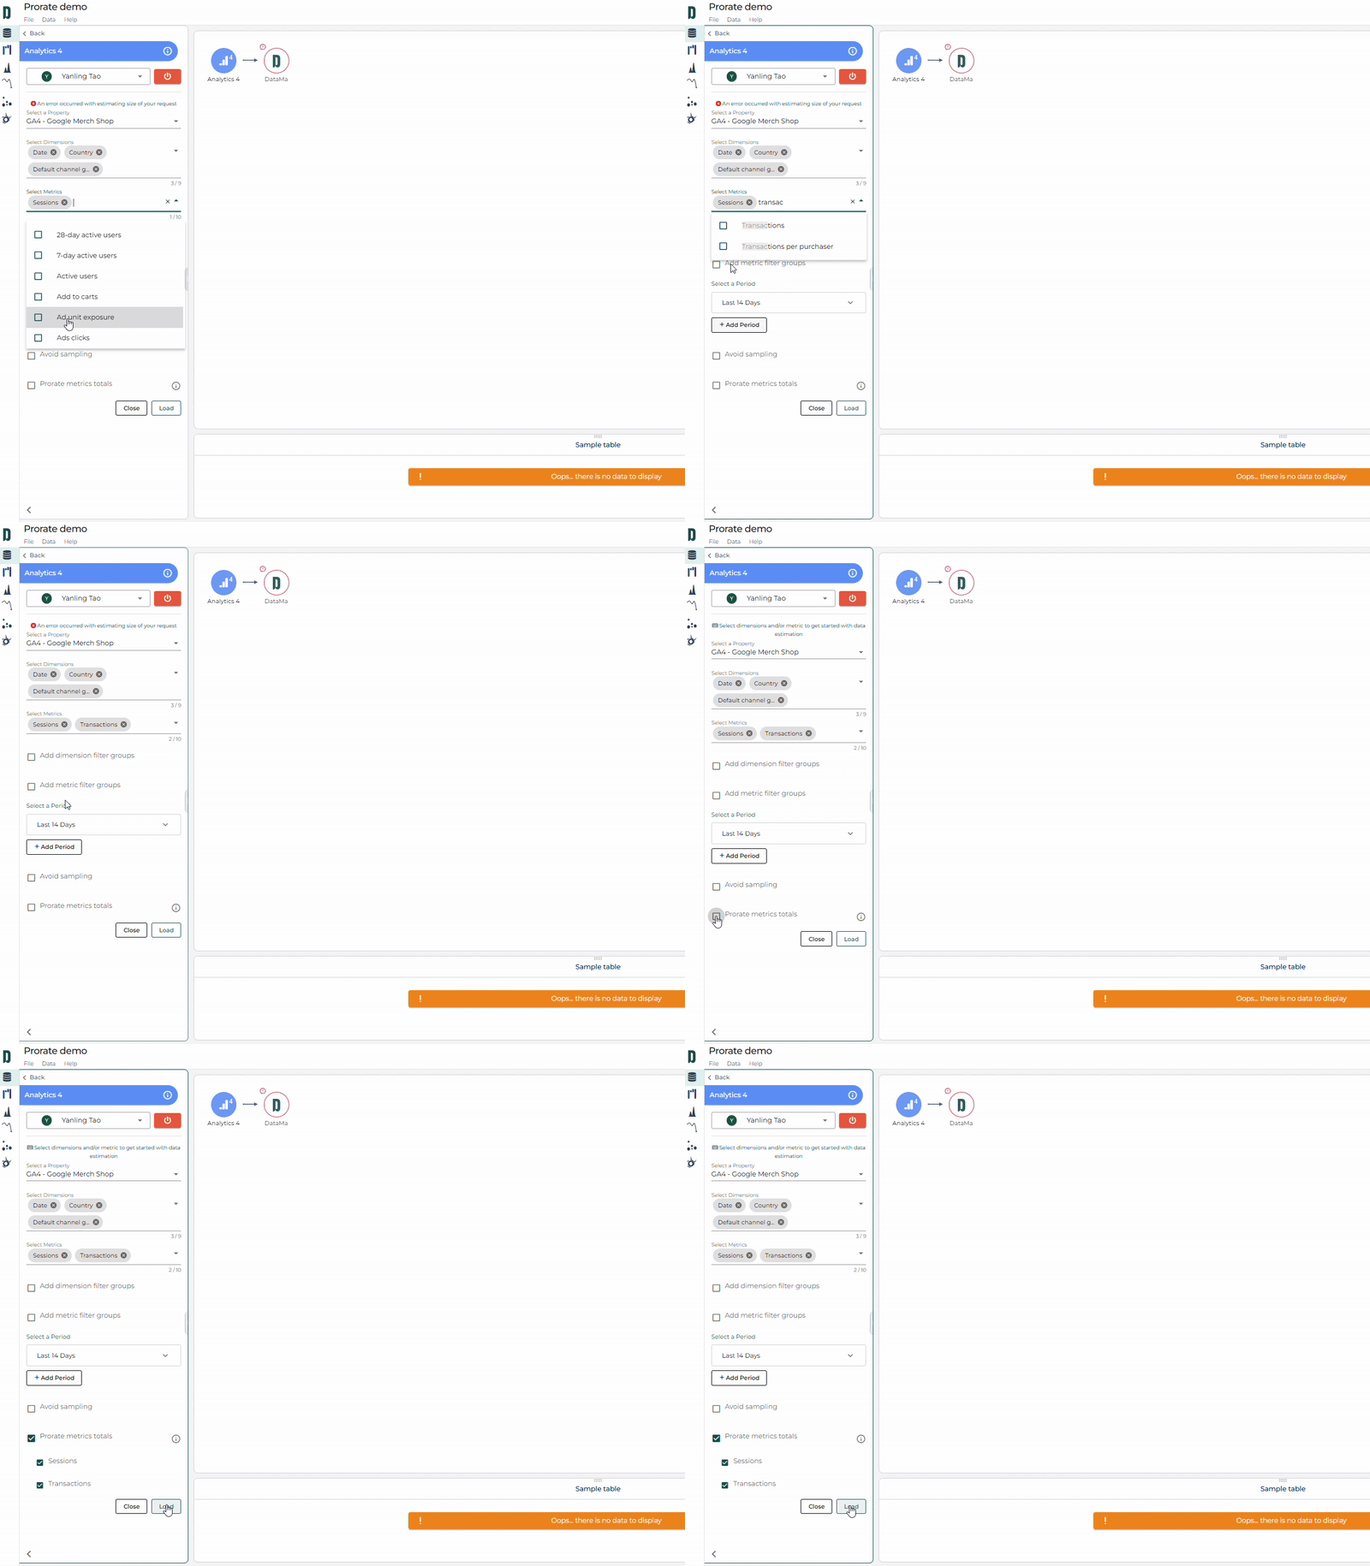
If you regularly export data from GA4, you’ve probably noticed that some metrics can be double-counted when broken down by certain dimensions.
For example, if you export your sessions by product type, any session that views multiple products will be counted more than once.
With the Prorate feature in Datama Prep, this issue disappears💡
By enabling “Prorate metrics totals” before loading your GA4 data, you can safely pull metrics without inflating totals — whether overall or by dimension ✅
Give it a try and let us know what you think!
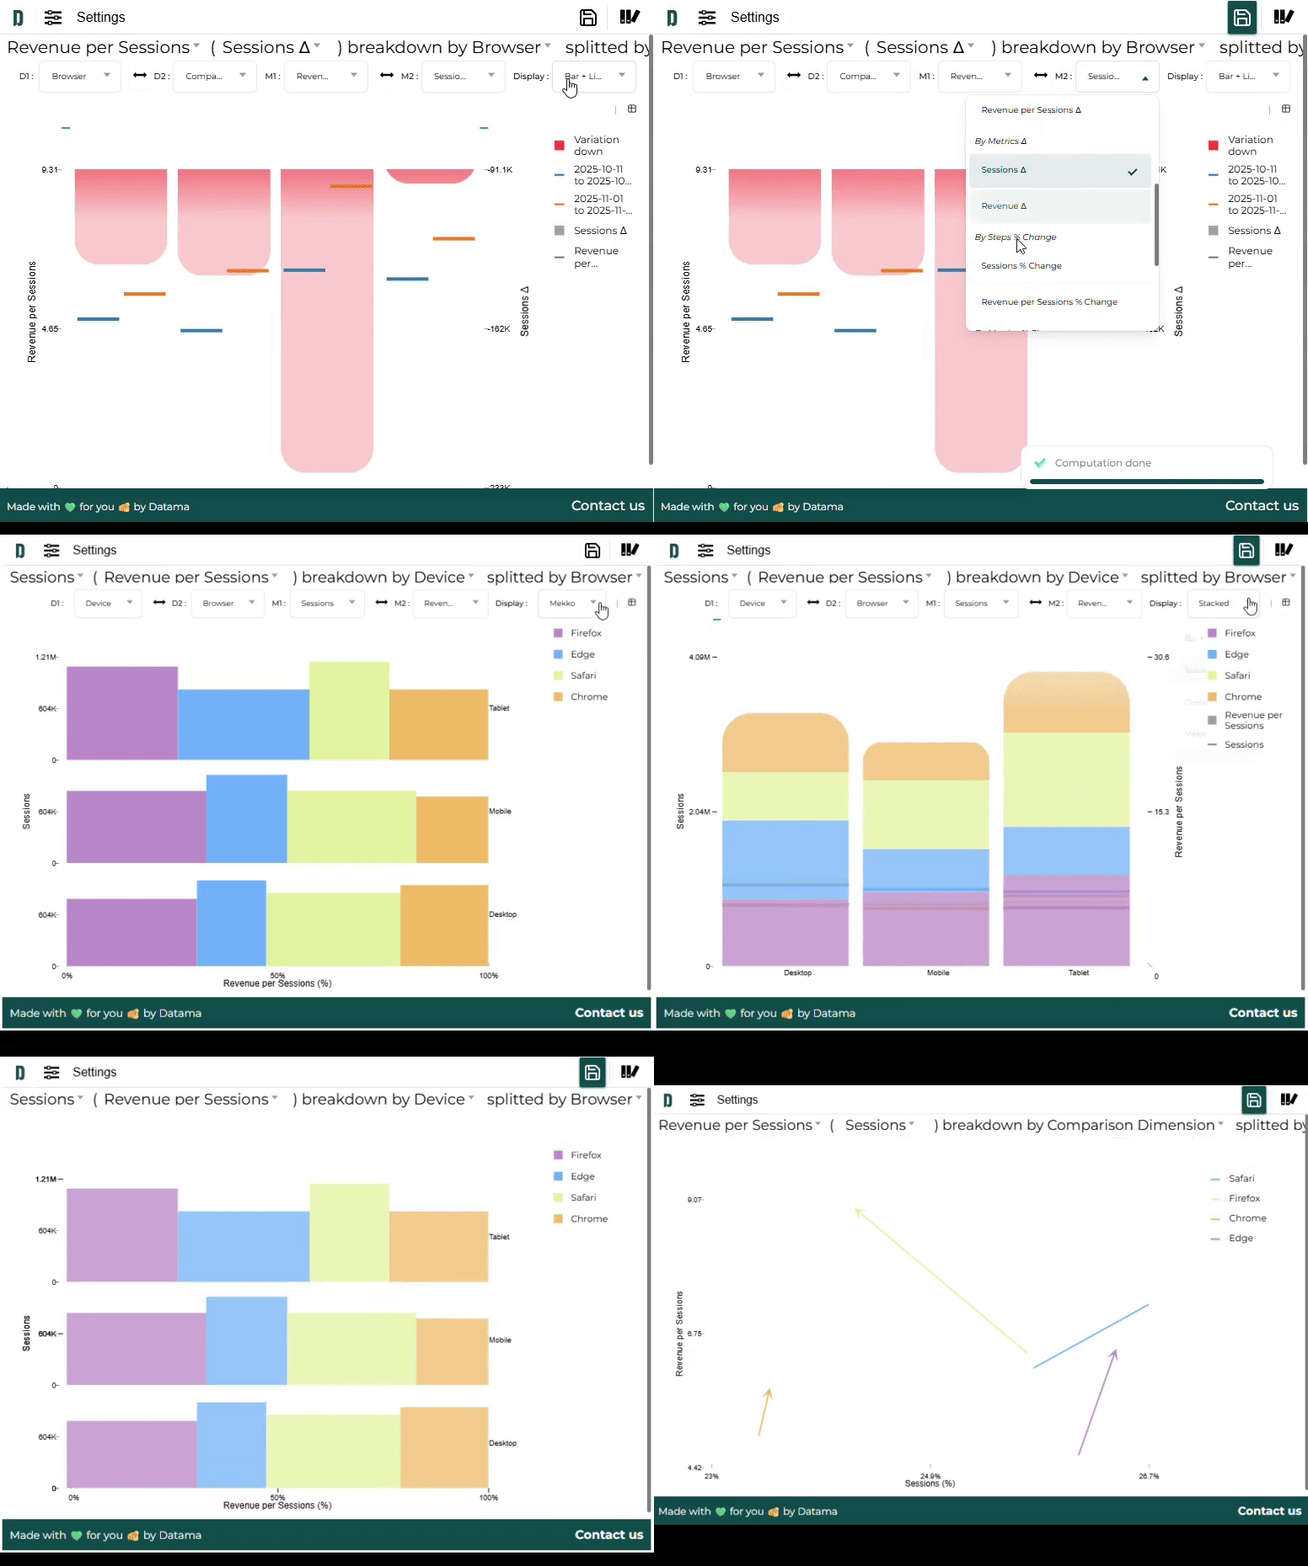
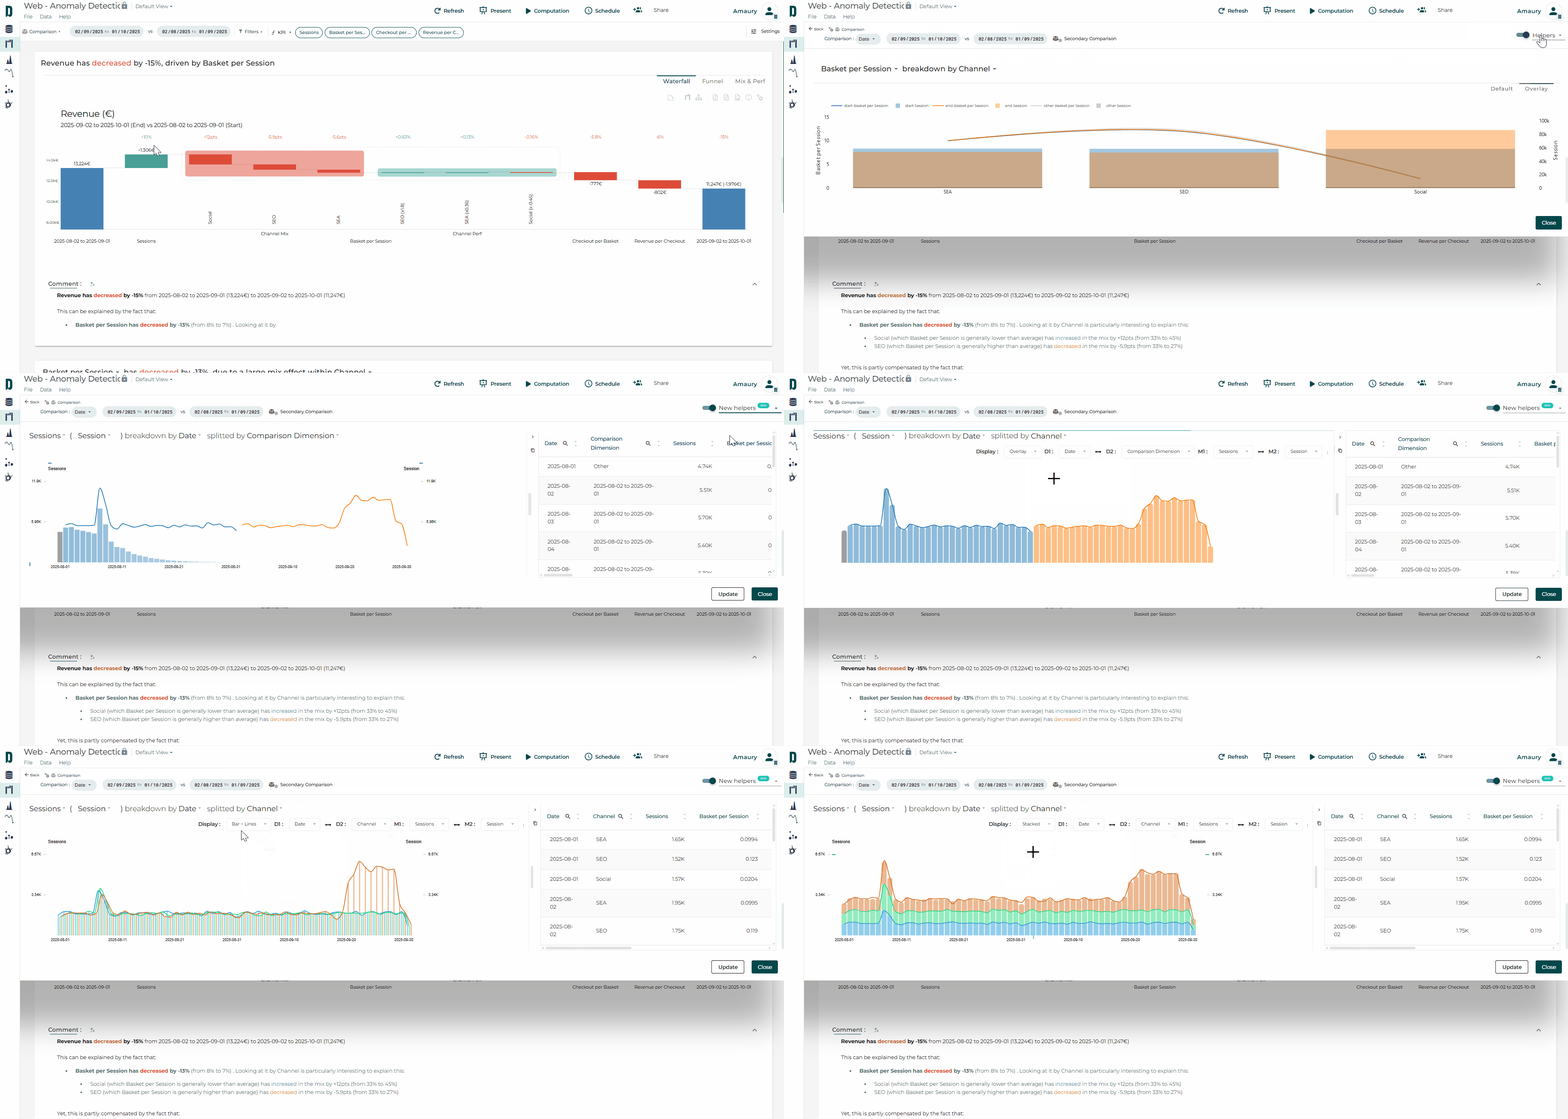
New Dimension Helper is now available in Datama in Beta. You can access it by selecting the new version in the top-right panel of Filters or Comparisons.
Here’s what’s new and improved:
Split any dimension by any other dimension, including Comparison dimensions ✨
View two metrics at once, across both market equation steps and original dataset metrics 📊
Smooth animations with seamless transitions help you intuitively understand what’s being visualized 💫
Table view that allows a quick access to a tabular version of your data and export to a spreadsheet with a single click (as CSV copy) 📝
Easily switch between views like Bar + Lines, Overlay, and Moves thanks to multiple preset charts 💡
Faster calculations and an improved legend compared to the previous helper ⚡
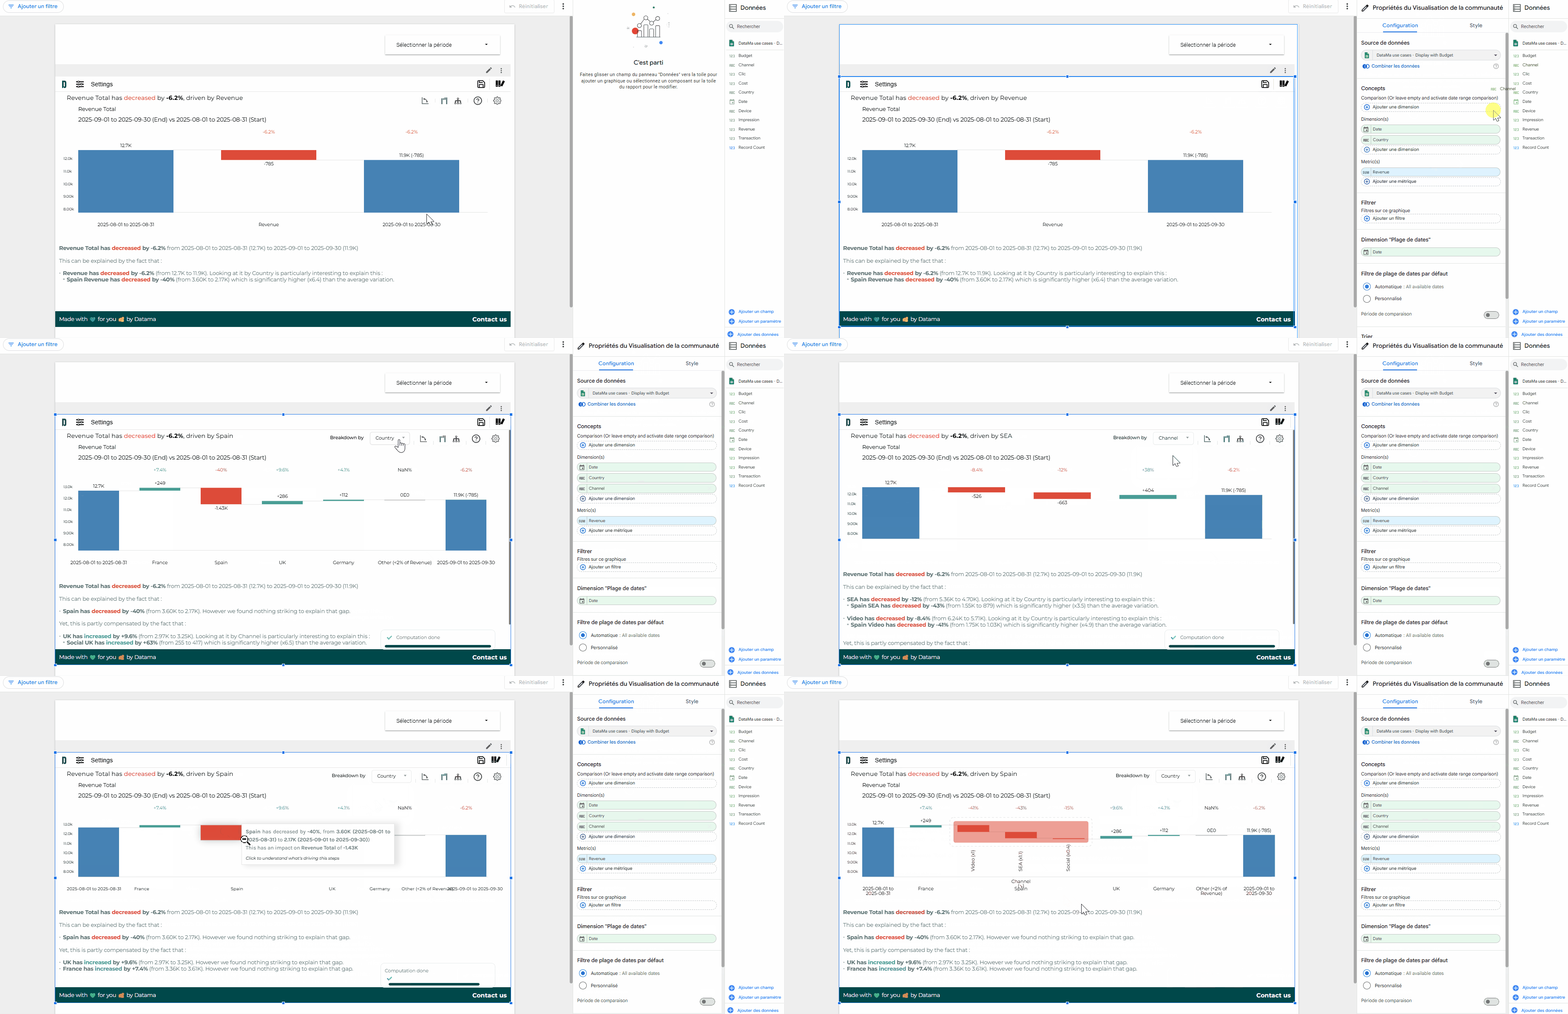
Dimension then Dimension in Datama Compare extension
In the Datama Compare extension (on all visualization tools), you want to analyze a single metric with multiple dimensions (at least 3).
Datama allows you to automatically analyze your primary breakdown (e.g. Country), which will make up the stages of your Waterfall, and then the most relevant dimension (e.g. Channel) when you zoom in on a stage 🔍, all without any additional transformation 💡
Select your primary breakdown via the “Breakdown by” dropdown that appears at the top of the waterfall 🤓
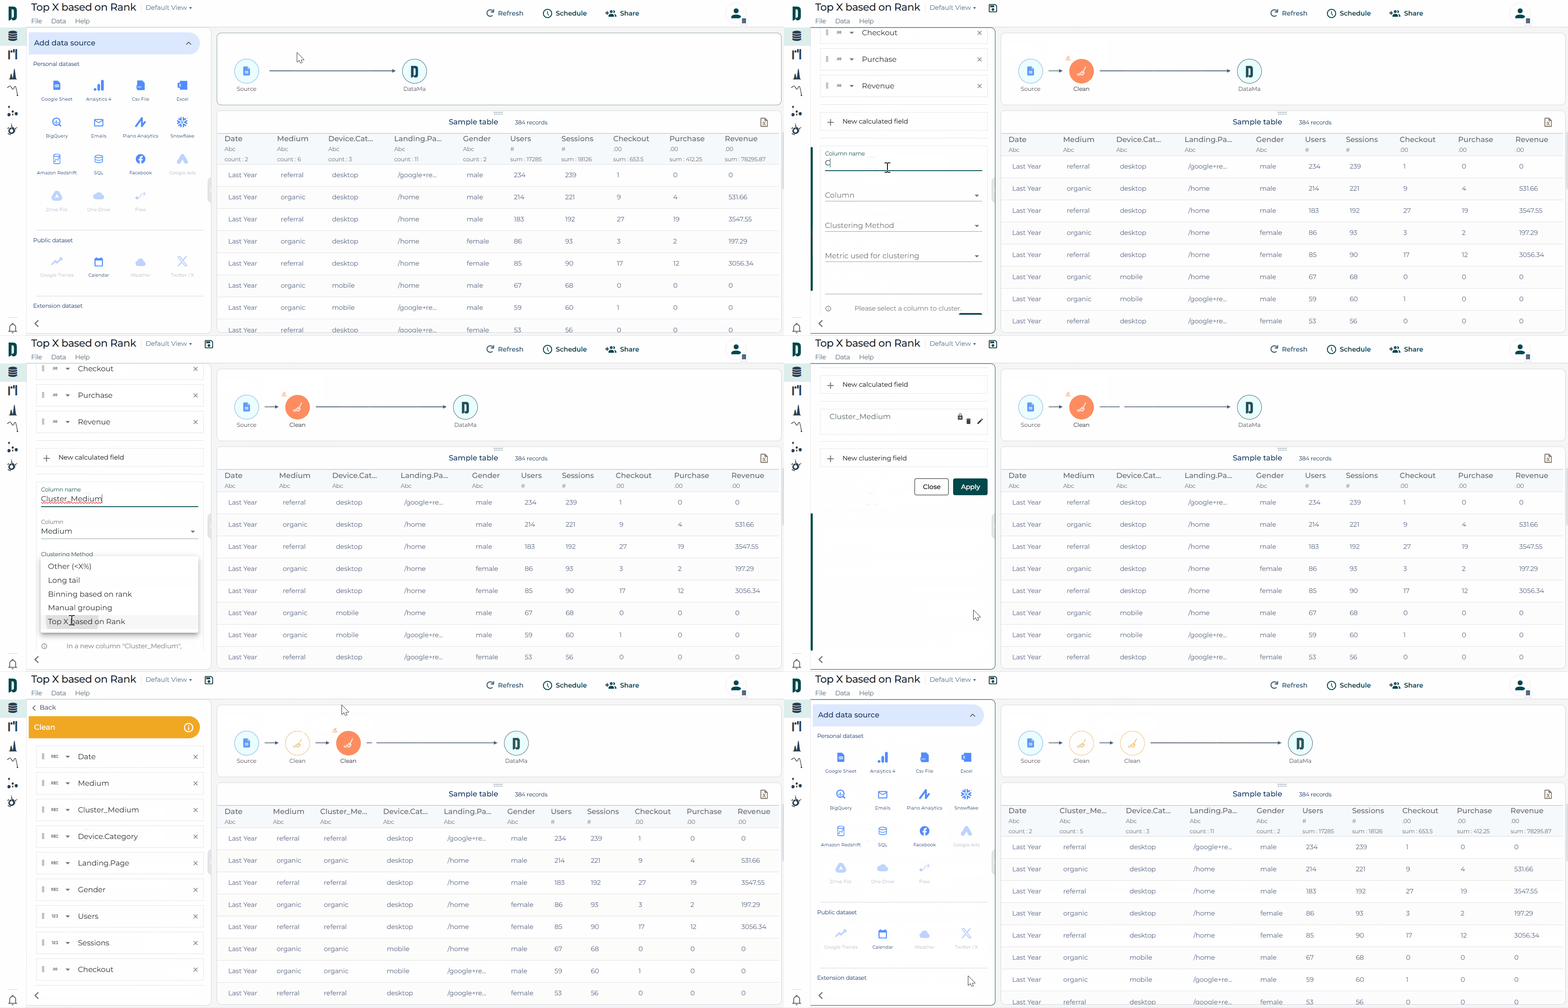
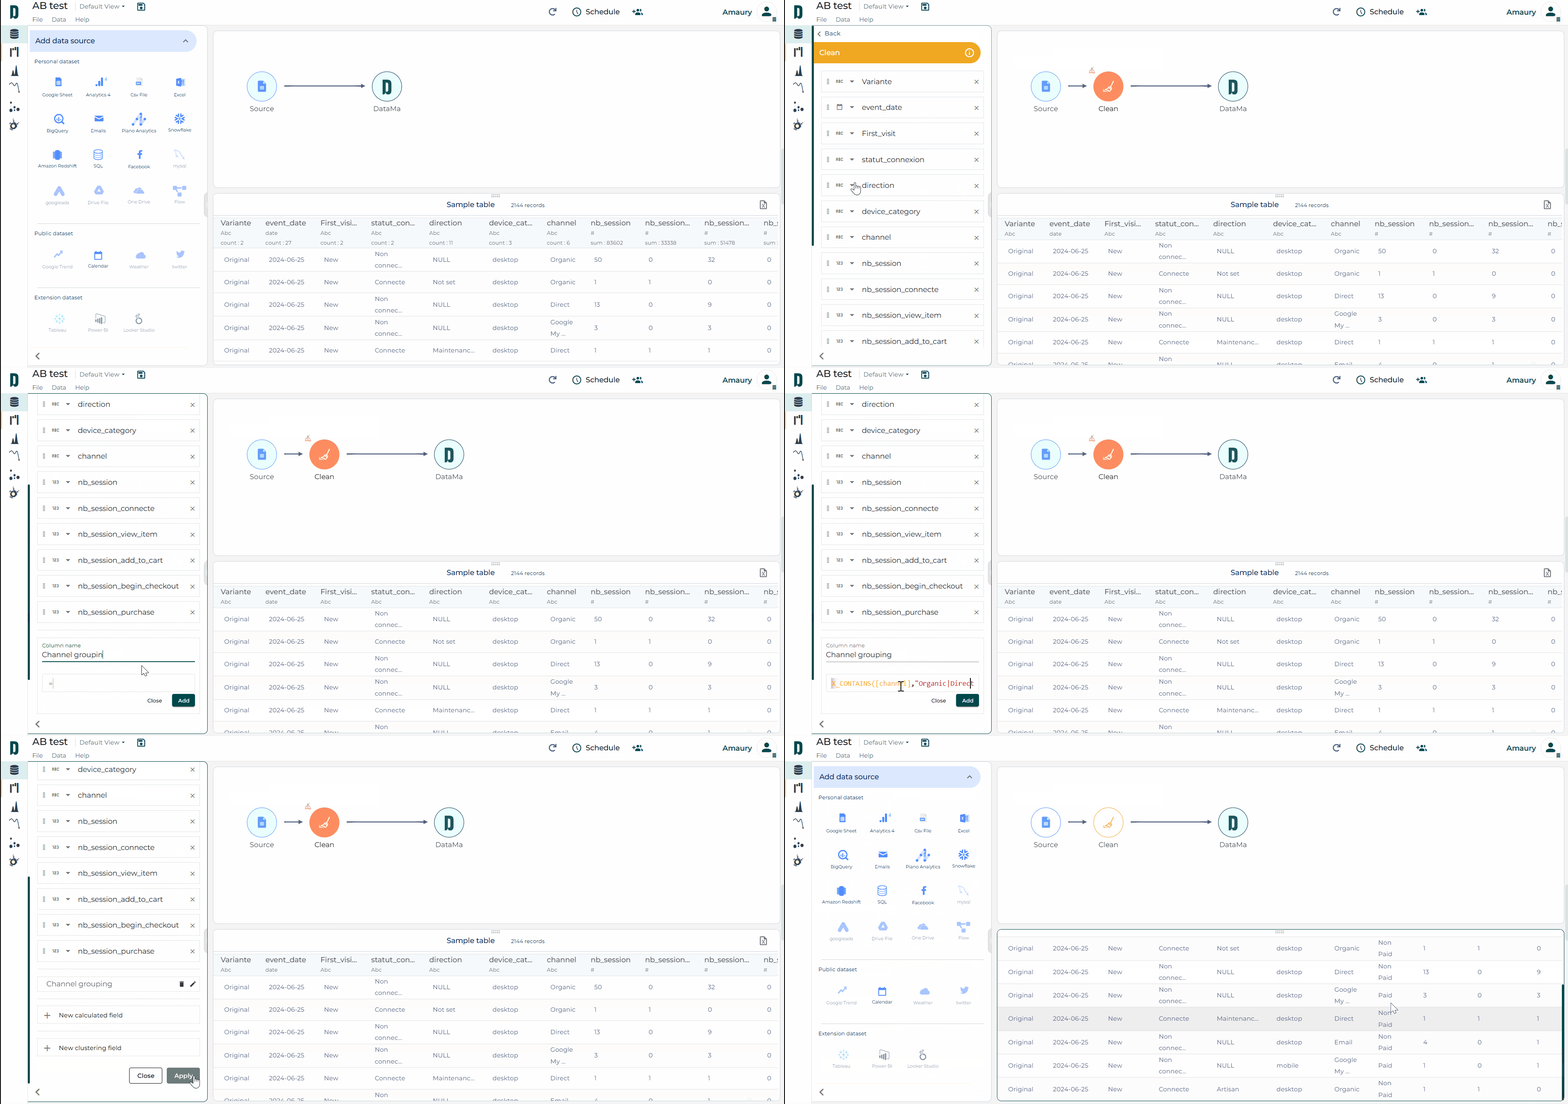
To reduce the size of your data, Datama offers several methods in the “Clean” block in the “New clustering field” section. The “Top X based on Rank” method has just been added 🆕
With this method, you can now:
Keep only the best-performing segments of a dimension according to a given metric 🎯
Group all other segments into an “Other” bucket.
This approach reduces the size of your data and allows you to focus on the essentials while maintaining the relevance of the analysis 📊
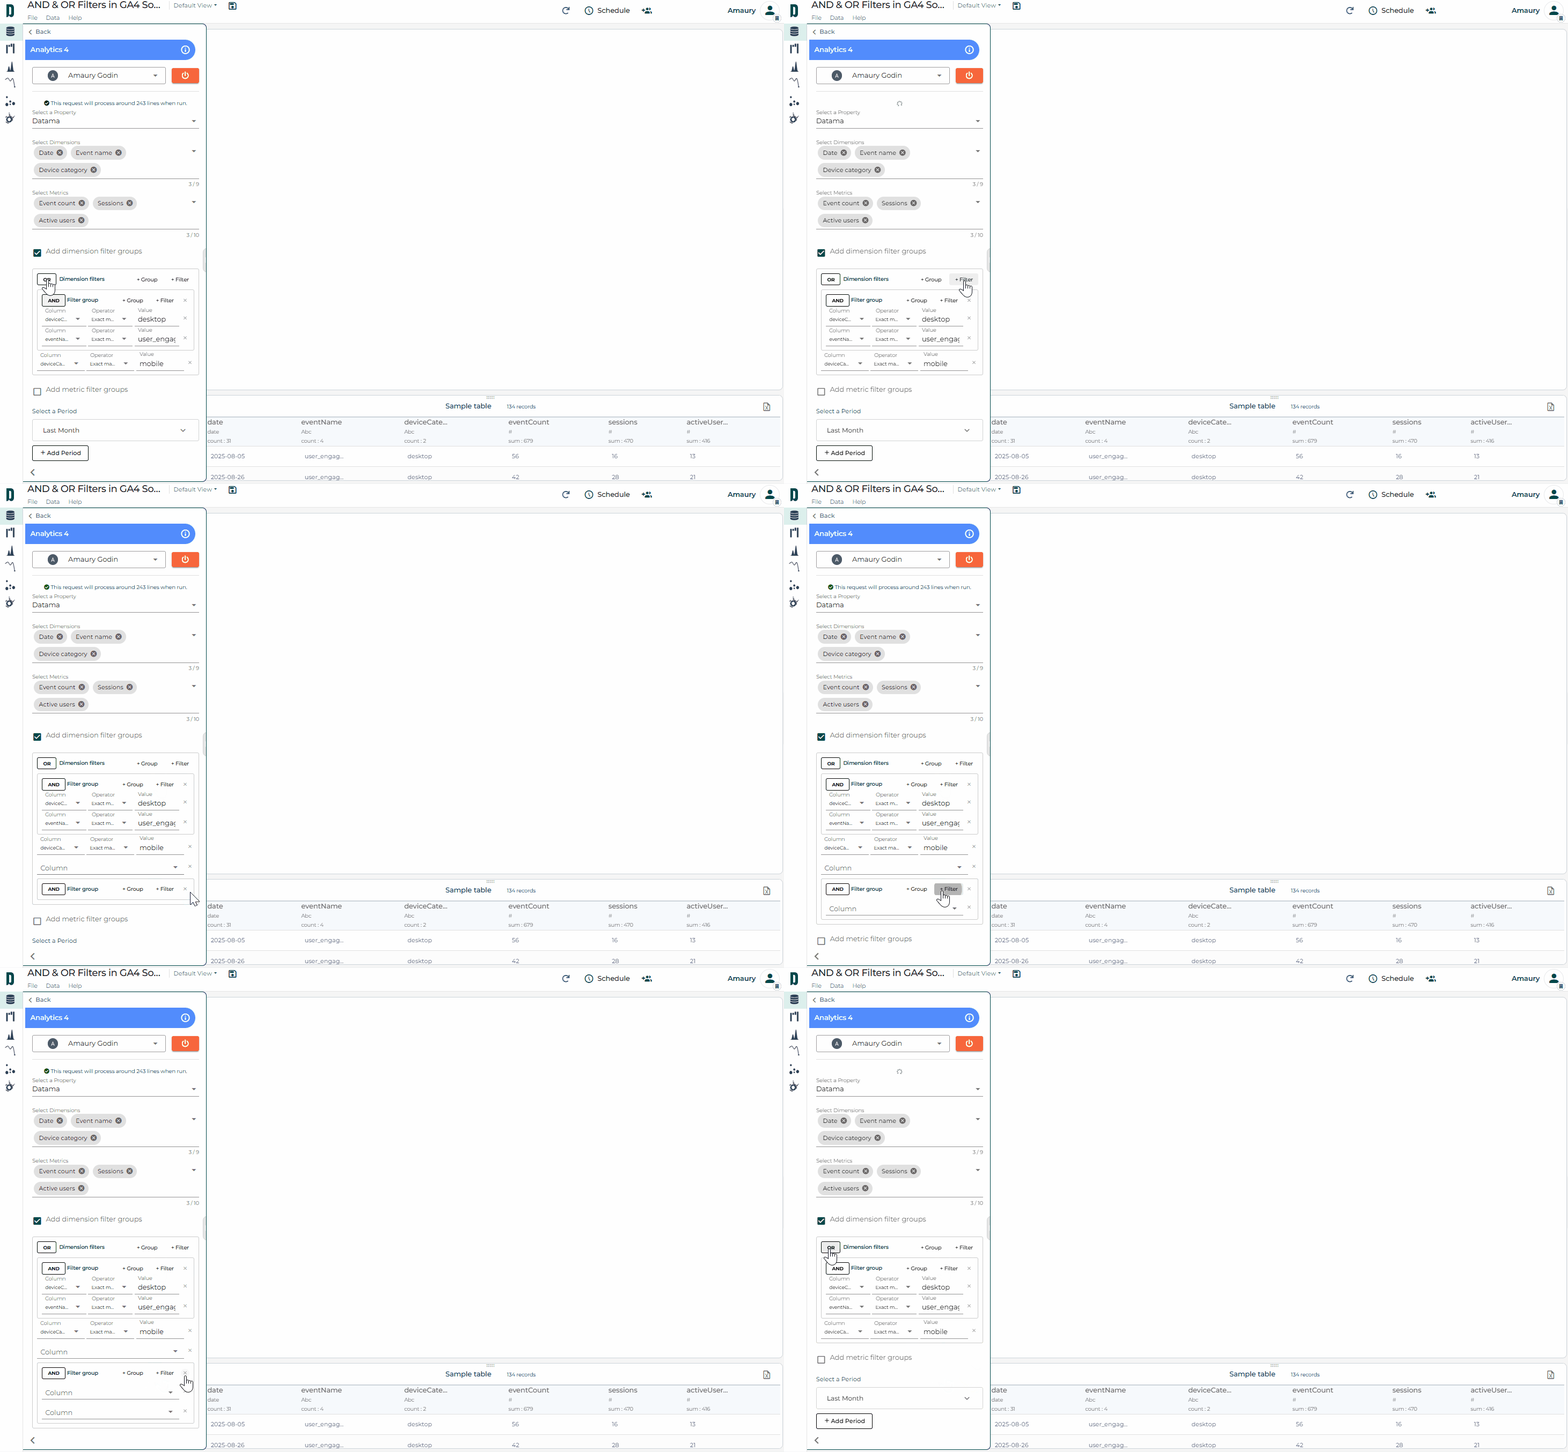
Great news for Datama Prep users working with a GA4 source: you can now build more advanced filters by combining “AND” and “OR” clauses, up to 3 levels deep 🤓
This makes it easier to extract the exact number of users or sessions who performed at least two different types of actions/events💡
Reminder 📝: the GA4 source is still subject to API limitations. Always make sure your chosen metrics and dimensions can be queried together (both in the data you retrieve and in the filters you apply).
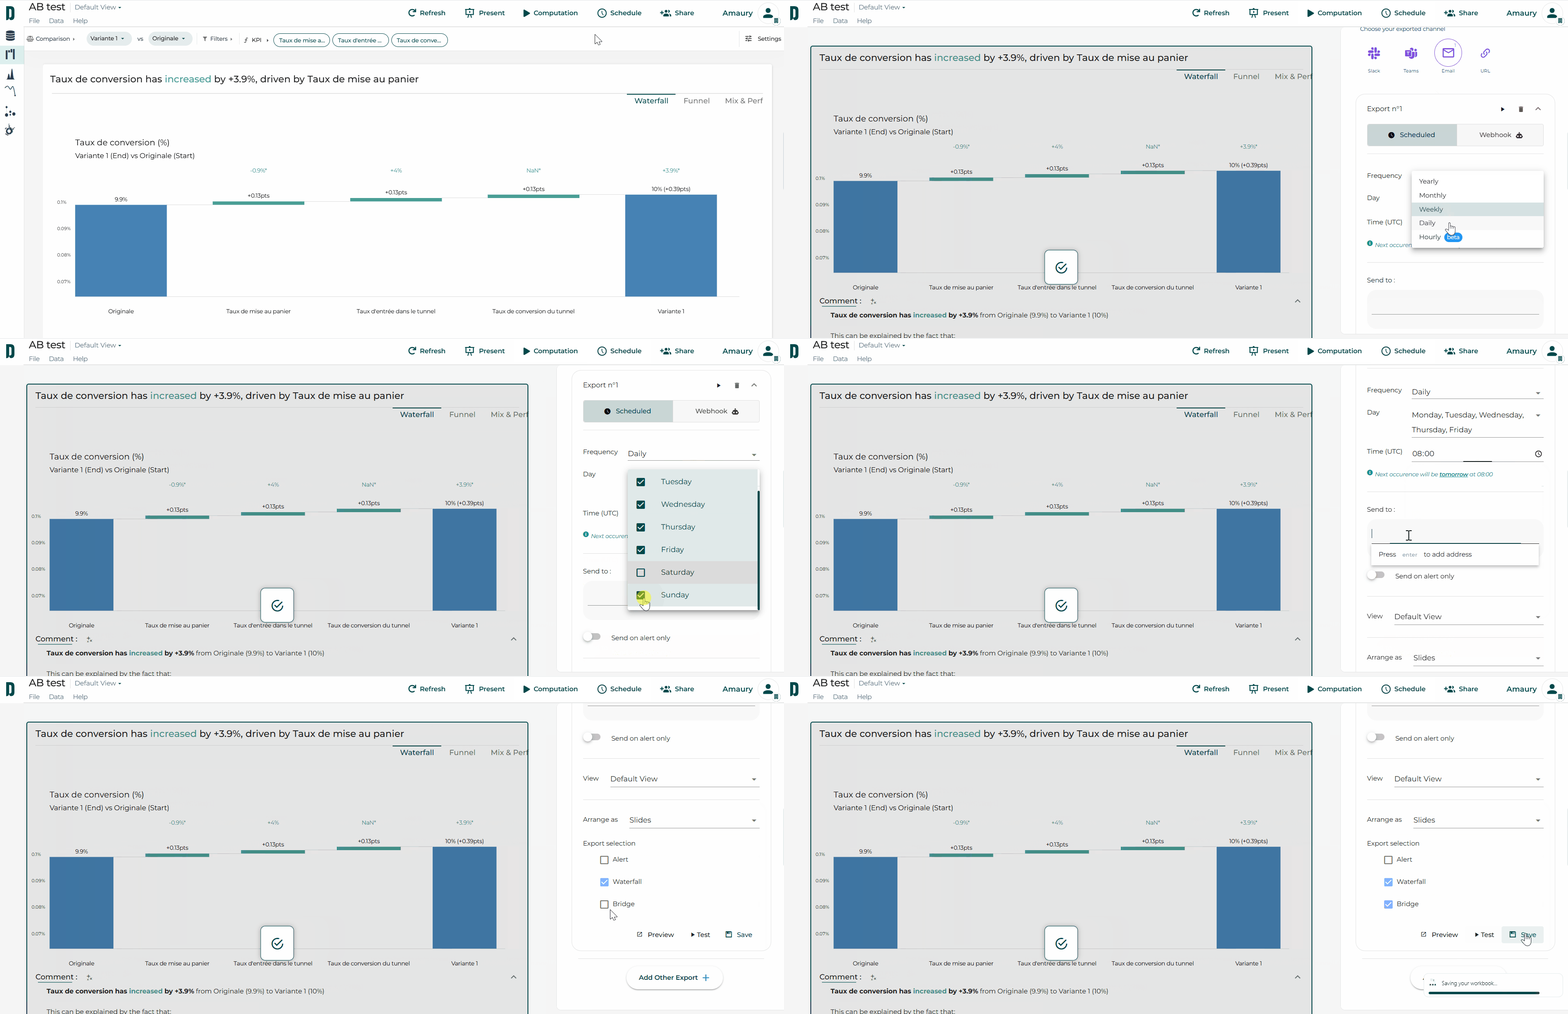
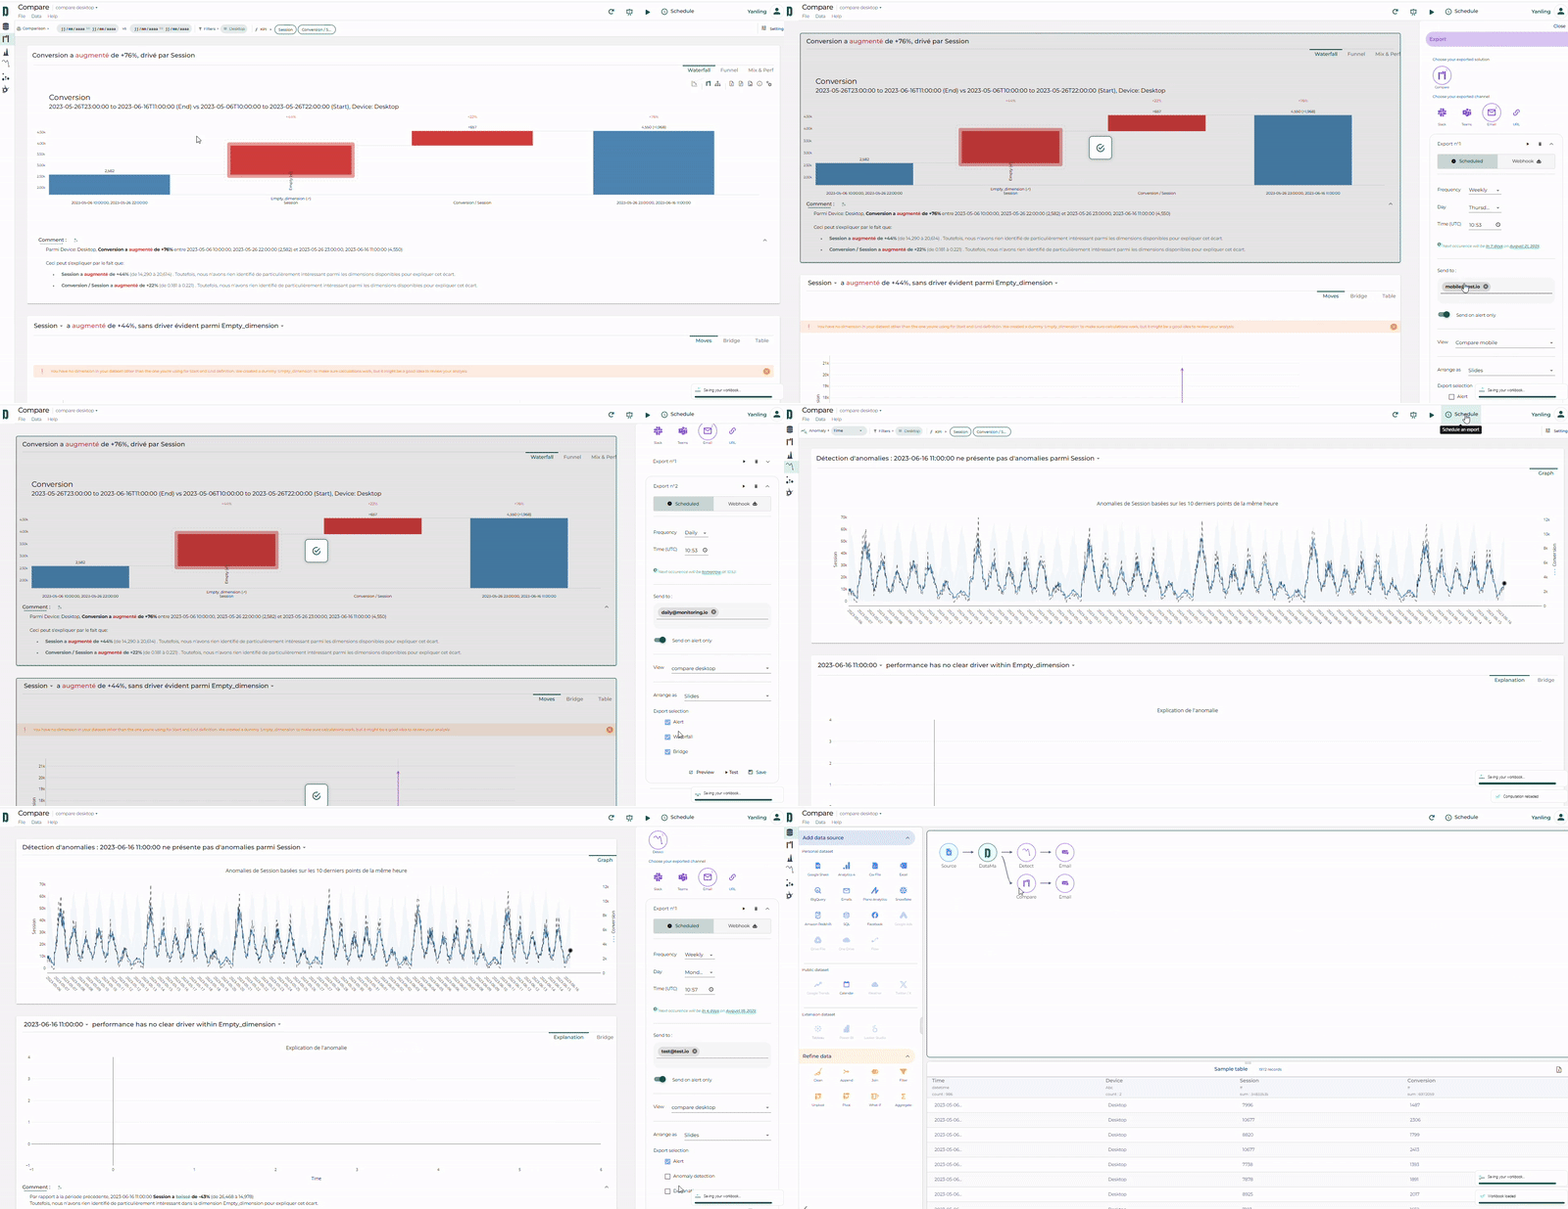
Want the same workbook to reach different teams in different ways? With Datama Export, schedule the same report via multiple channels, at different frequencies, times, and formats—all from one place.
Before scheduling, you can:
Preview : see exactly what will be sent 📧
Test : send a test export that mirrors the scheduled run 🗓️
Make Datama work your way. 🚀
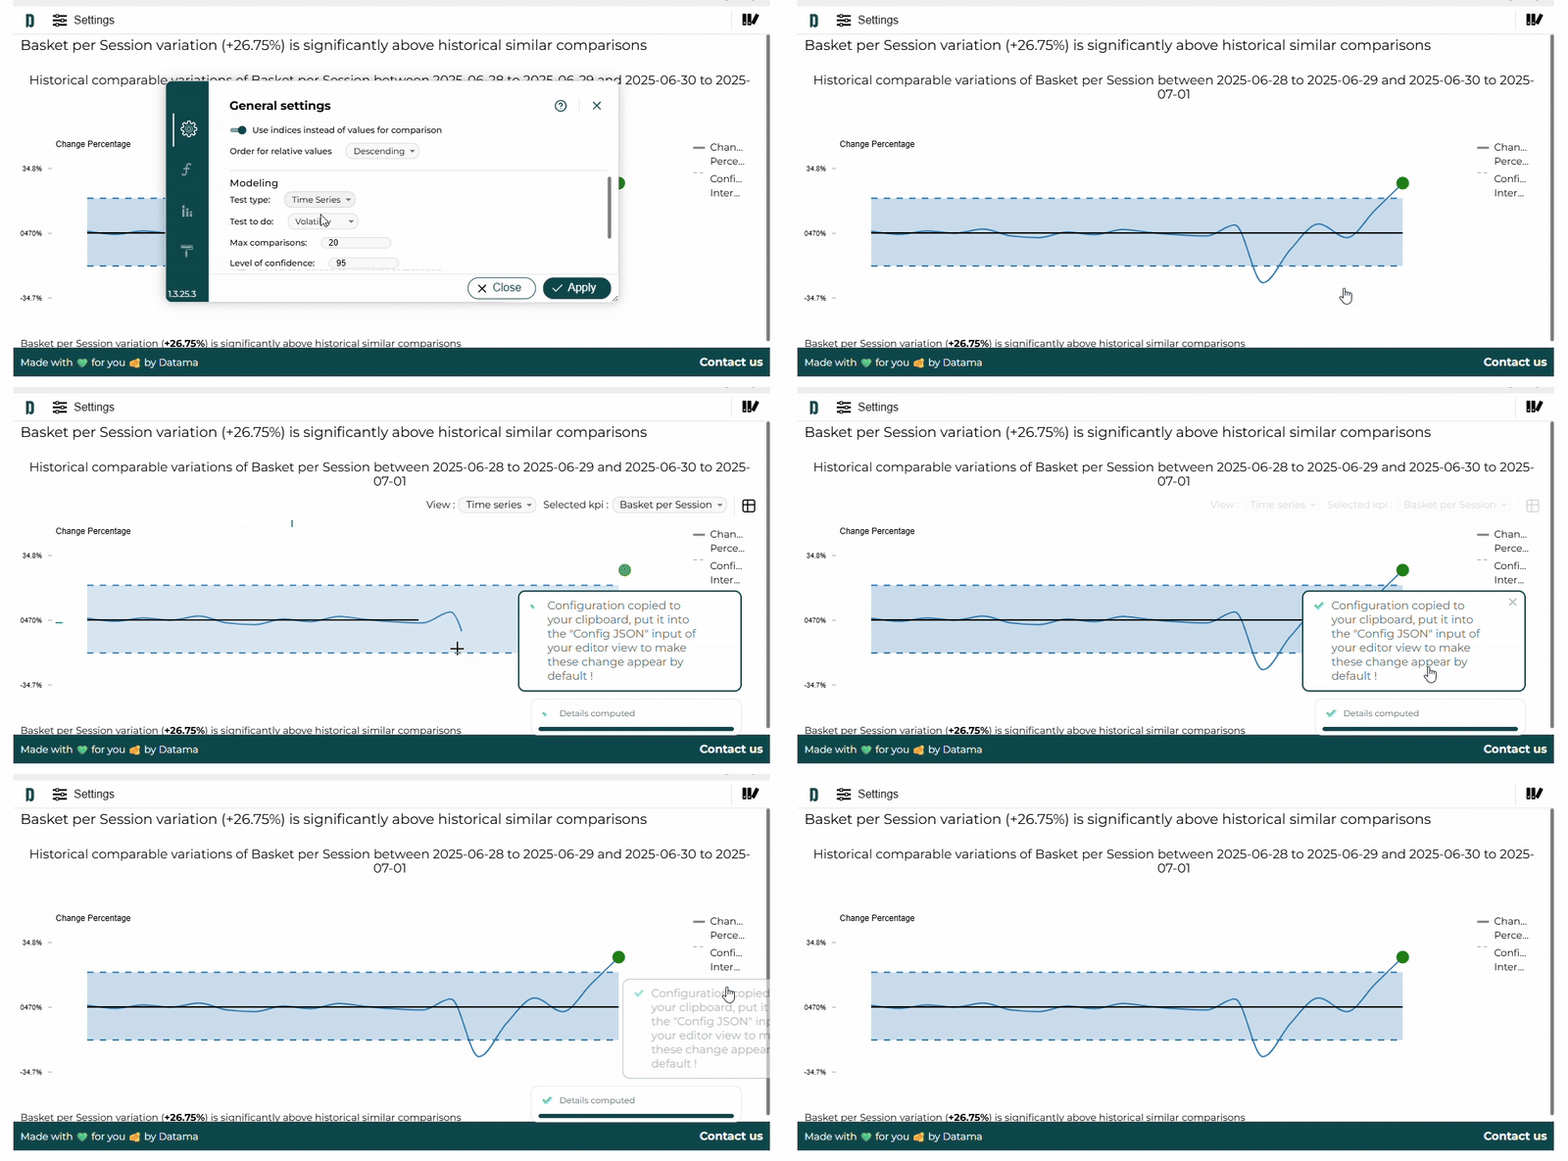
Datama Assess tells you how significant your KPI changes are
When you’re tracking KPI variations between two periods (e.g., this week vs. last week), you usually know how much the KPI changed — but not how meaningful that change is compared to historical patterns.
That’s exactly what Datama Assess – Volatility helps with.
Let’s say your average basket dropped by x% from Week 45 to Week 46. With Assess, you can instantly compare this variation with previous week-to-week changes (Week 44 → 45, 43 → 44, etc.). This allows you to understand whether the drop is within the normal range — or whether it’s an outlier worth investigating.
🧠 In short: you stop reacting blindly to KPI movements and start knowing when they truly matter.
👉 Try it now on our website version or directly in the Datama extension (Looker studio, PowerBI, Tableau, and Qlik).
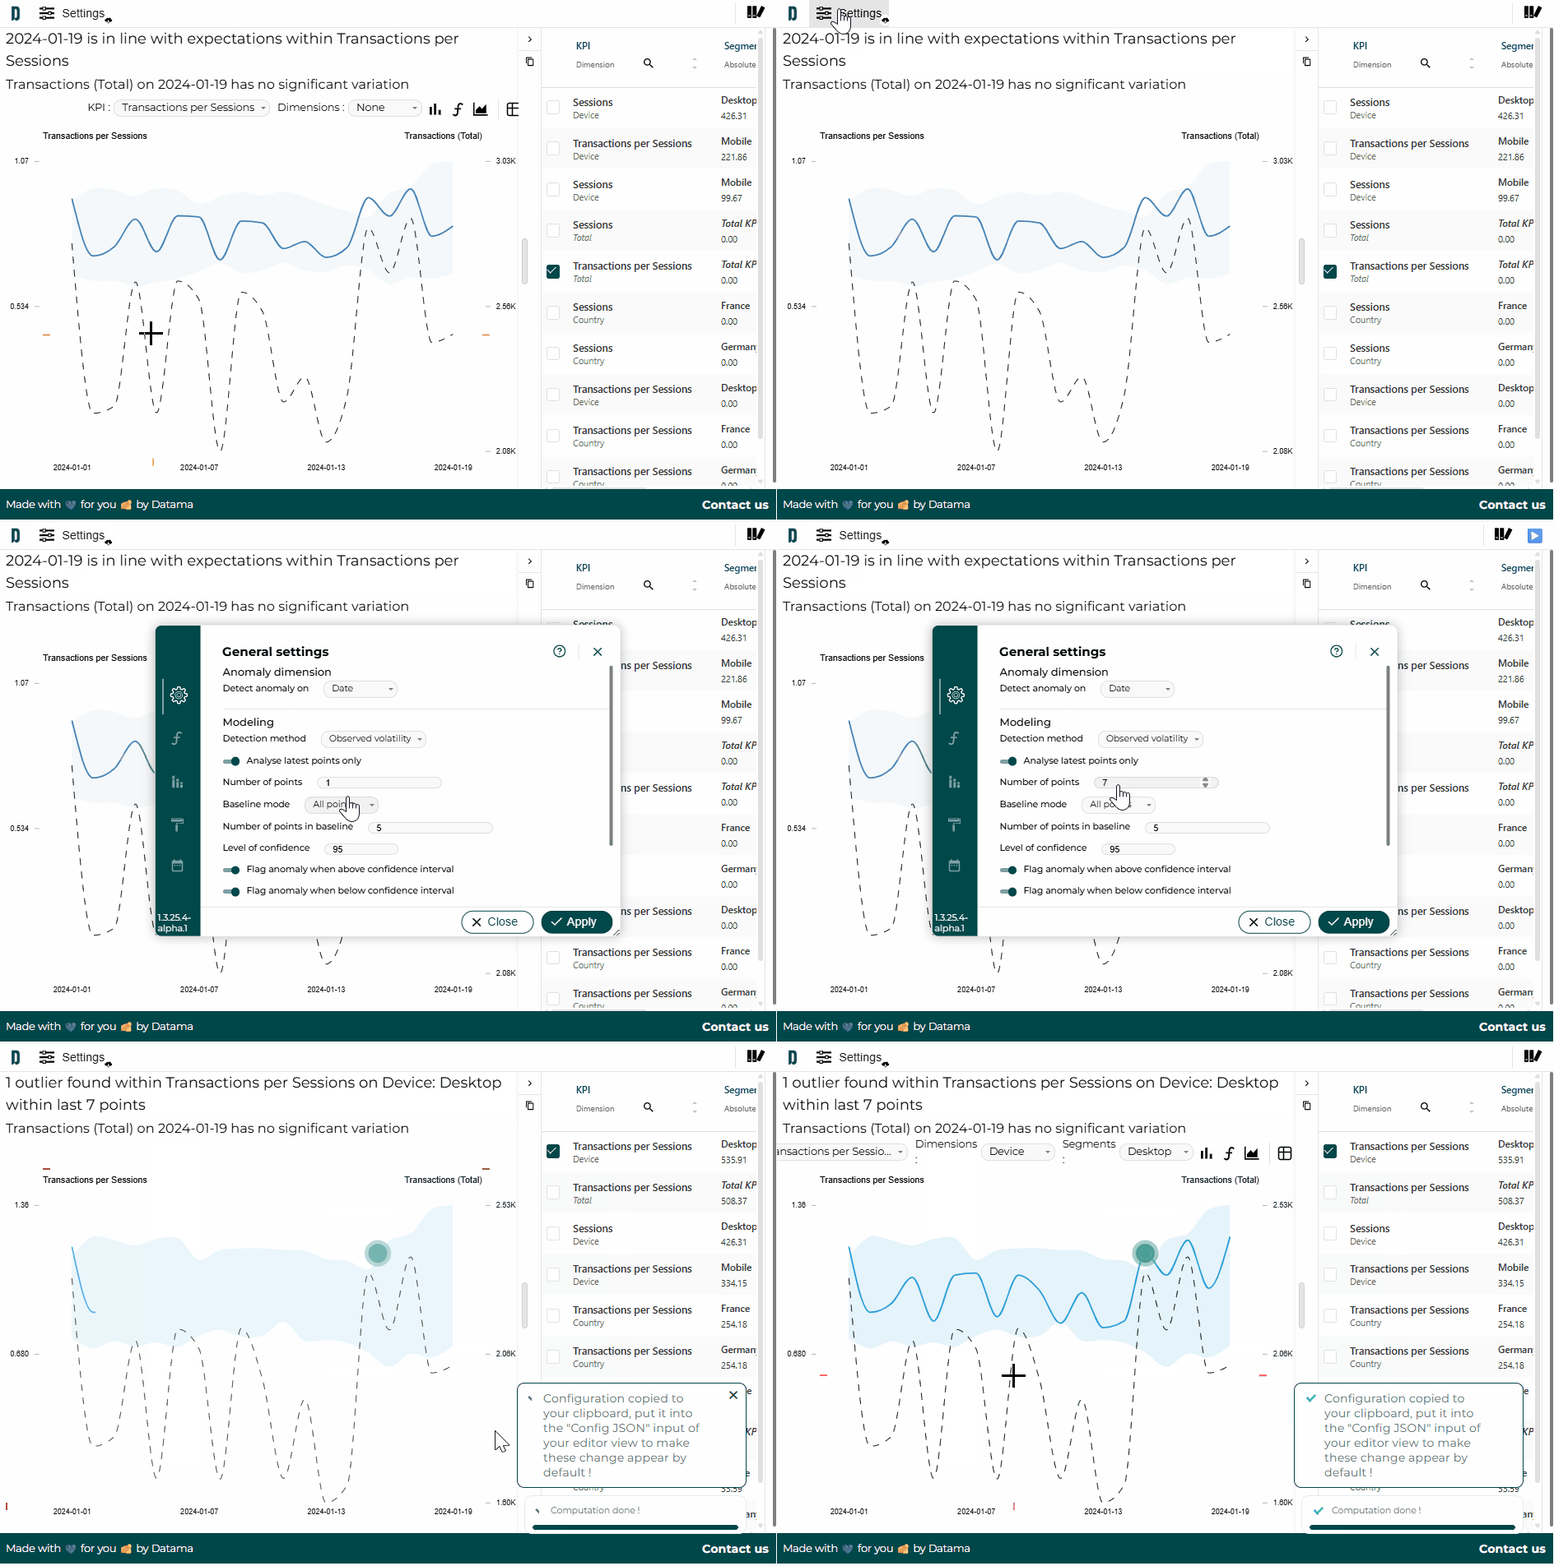
Until now, you had two options for anomaly detection on Datama Detect Light: either the entire dataset or only the last point. Not very granular, we admit 😓
Now you can choose how many points you want to monitor for anomalies! 🎯
Use case: do you send weekly reports? Set Detect to analyze only the last 7 days. Result: a prioritized list of anomalies over the last week, without unnecessary noise from past weeks.📅
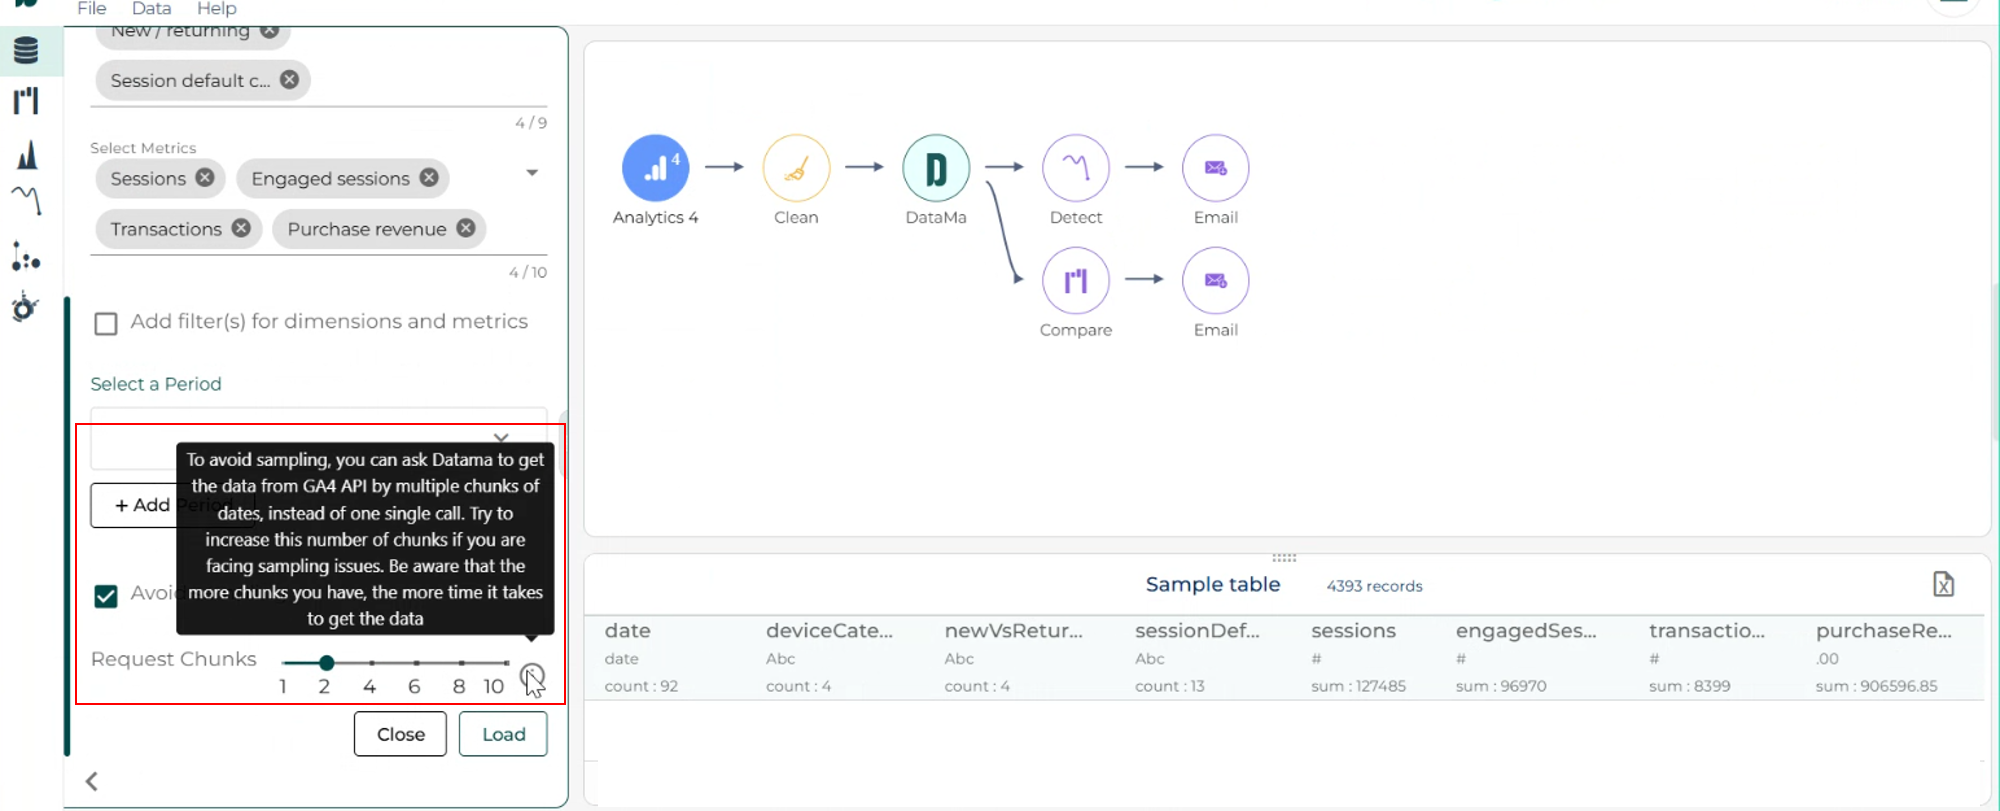
If you connect Google Analytics to Datama and work with large datasets, GA4 might sample your data — which can lead to inaccurate insights.
Fortunately, the new “Avoid sampling” option in Datama Prep solves this! 💡
With one click, you can split your dataset into smaller chunks, so GA4 treats them as unsampled. You would get more accurate data, better decisions. 🎯
Try it now and see the difference in your analysis! 📊
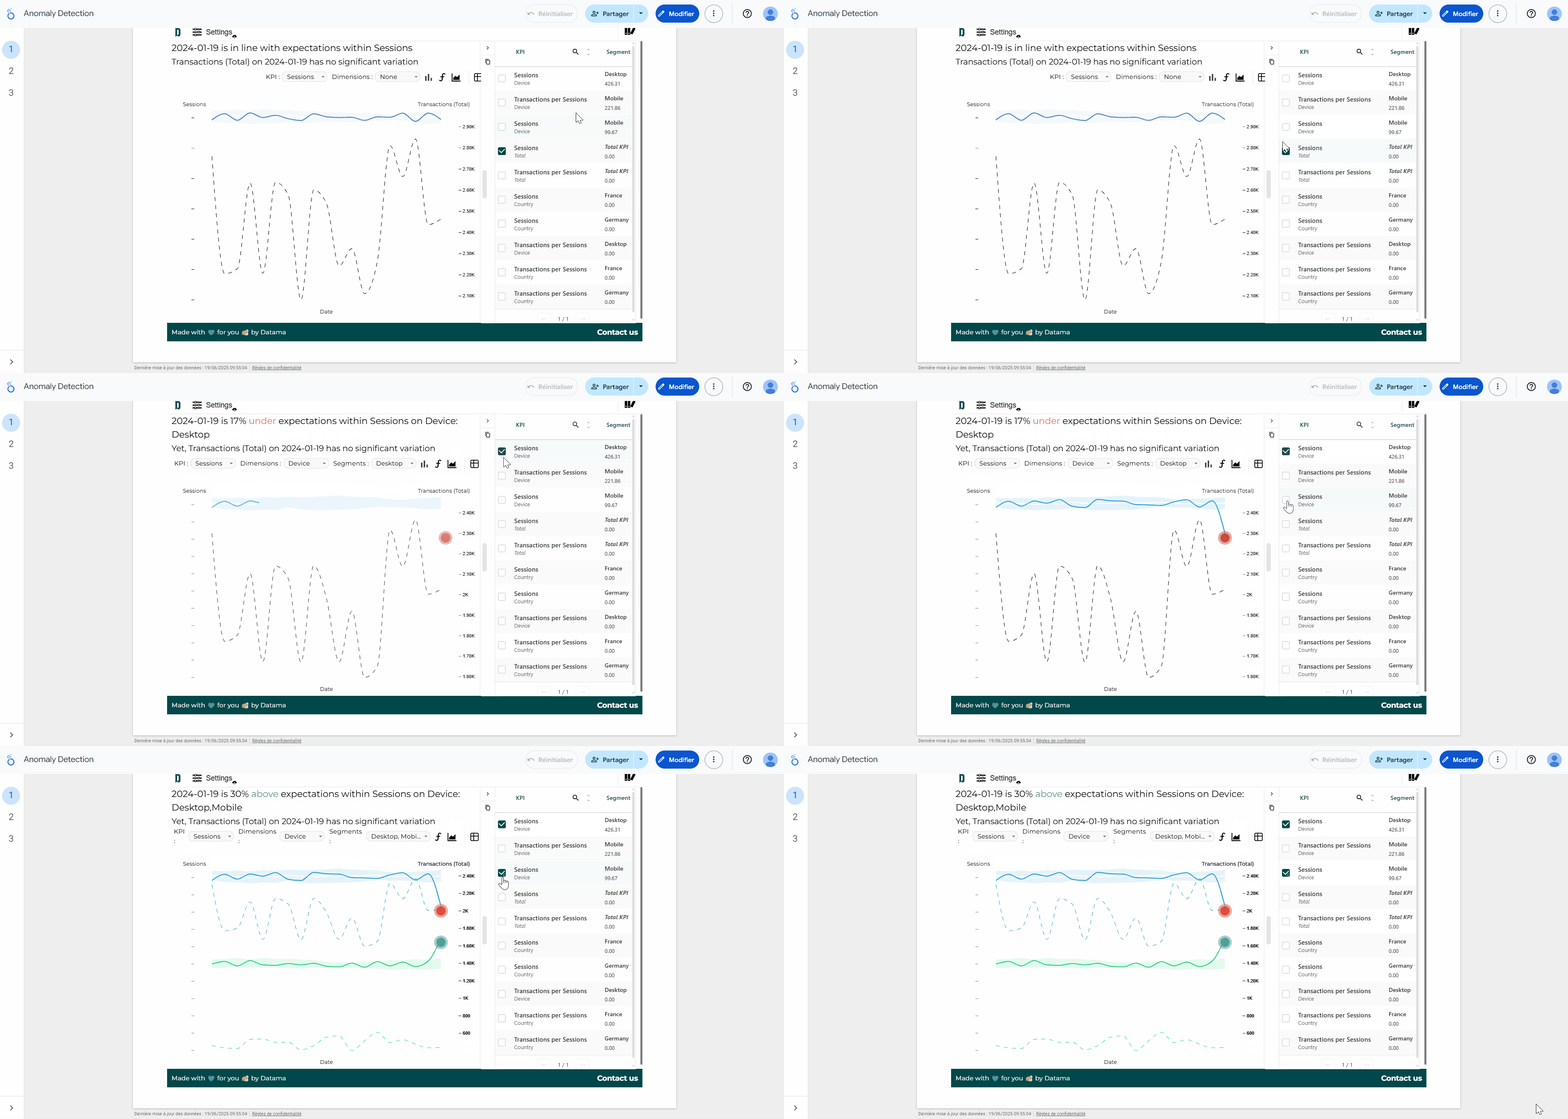
Detect anomaly on segment of your data (available on Datama Light Extension)
On Datama Light extension, a new feature is available to spot anomalies like never before! 🔎
Our latest update enables multi-dimensional outlier detection, giving you the power to uncover anomalies within any segment of your data dimension.
Example 📊: Say you’re analyzing performance by device category. While the global average may look fine here on session, Datama can now detect an unexpected spike or drop in a specific segment (uplift on mobile compensated by a drop on desktop).
Plus, each anomaly is scored for impact visible in the side table, so you focus on what truly matters first. ✨
Find an instructional video here 👈
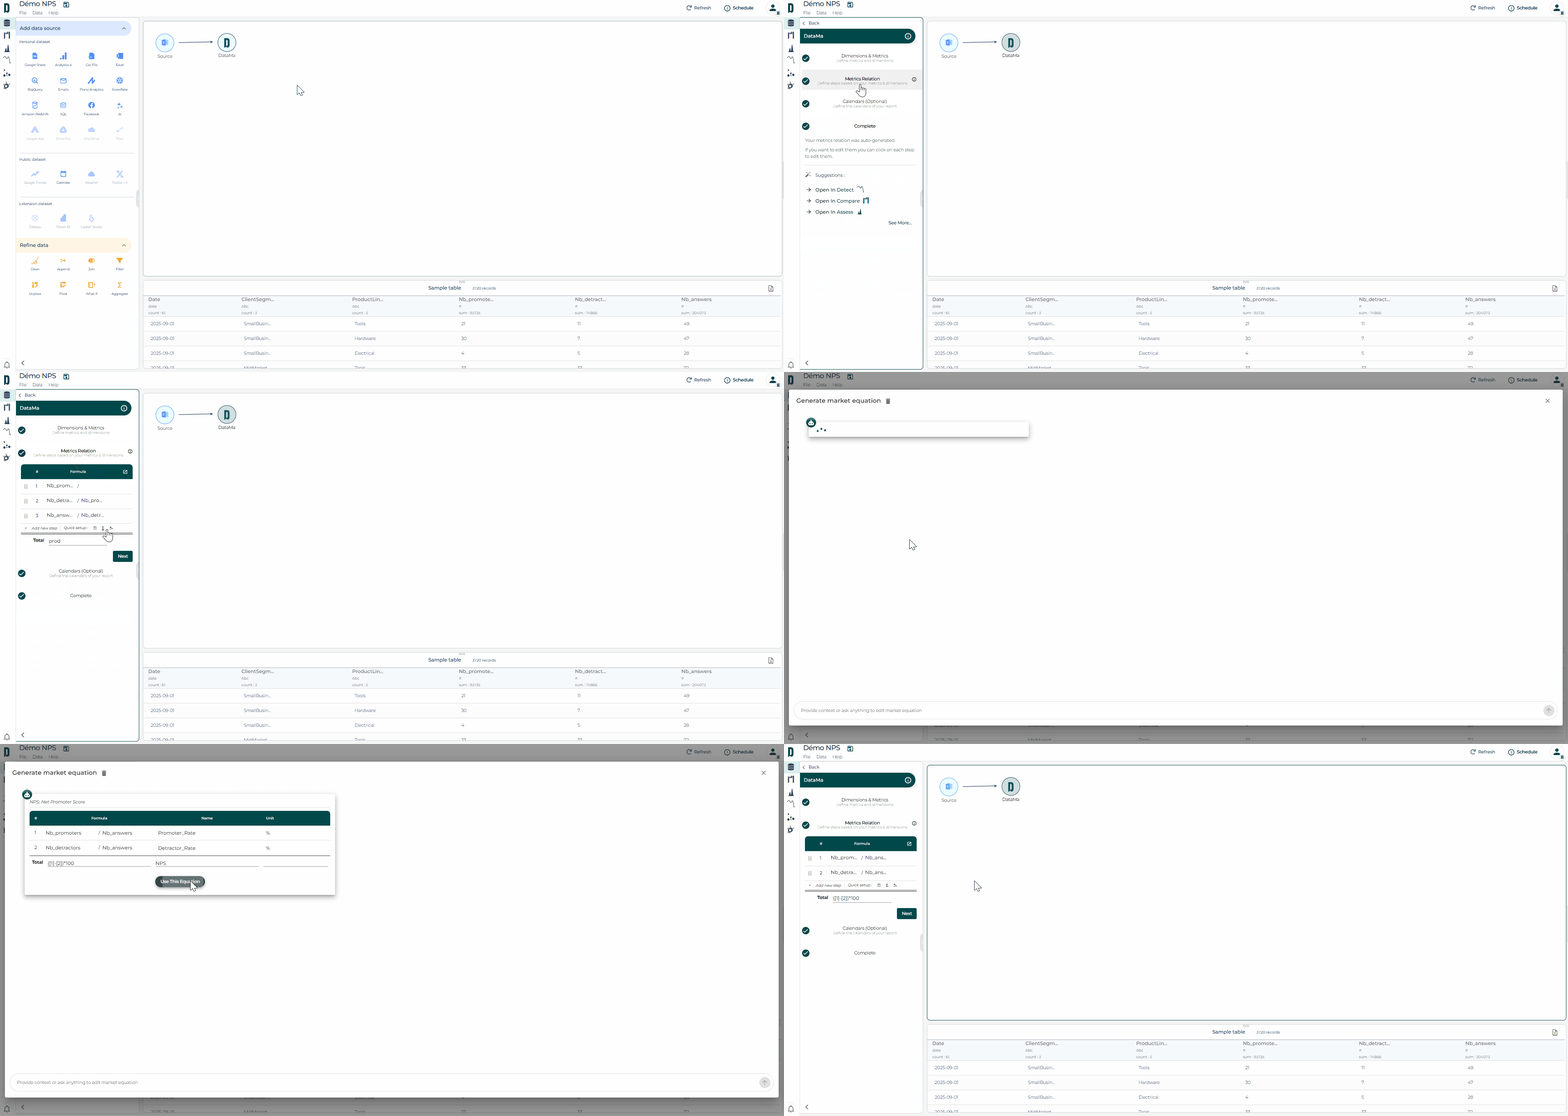
New functions available for calculated fields in Datama Prep!
Two new functions have been added to enhance your data transformation capabilities in Datama 🤓:
CASE(): Works like a CASE WHEN in SQL.
REGEX_CONTAINS(): Allows you to use regular expressions on strings and returns a Boolean ✅
These additions facilitate the segmentation, cleansing and manipulation of your data directly in Datama 🚀
Find all the functions available here 👈
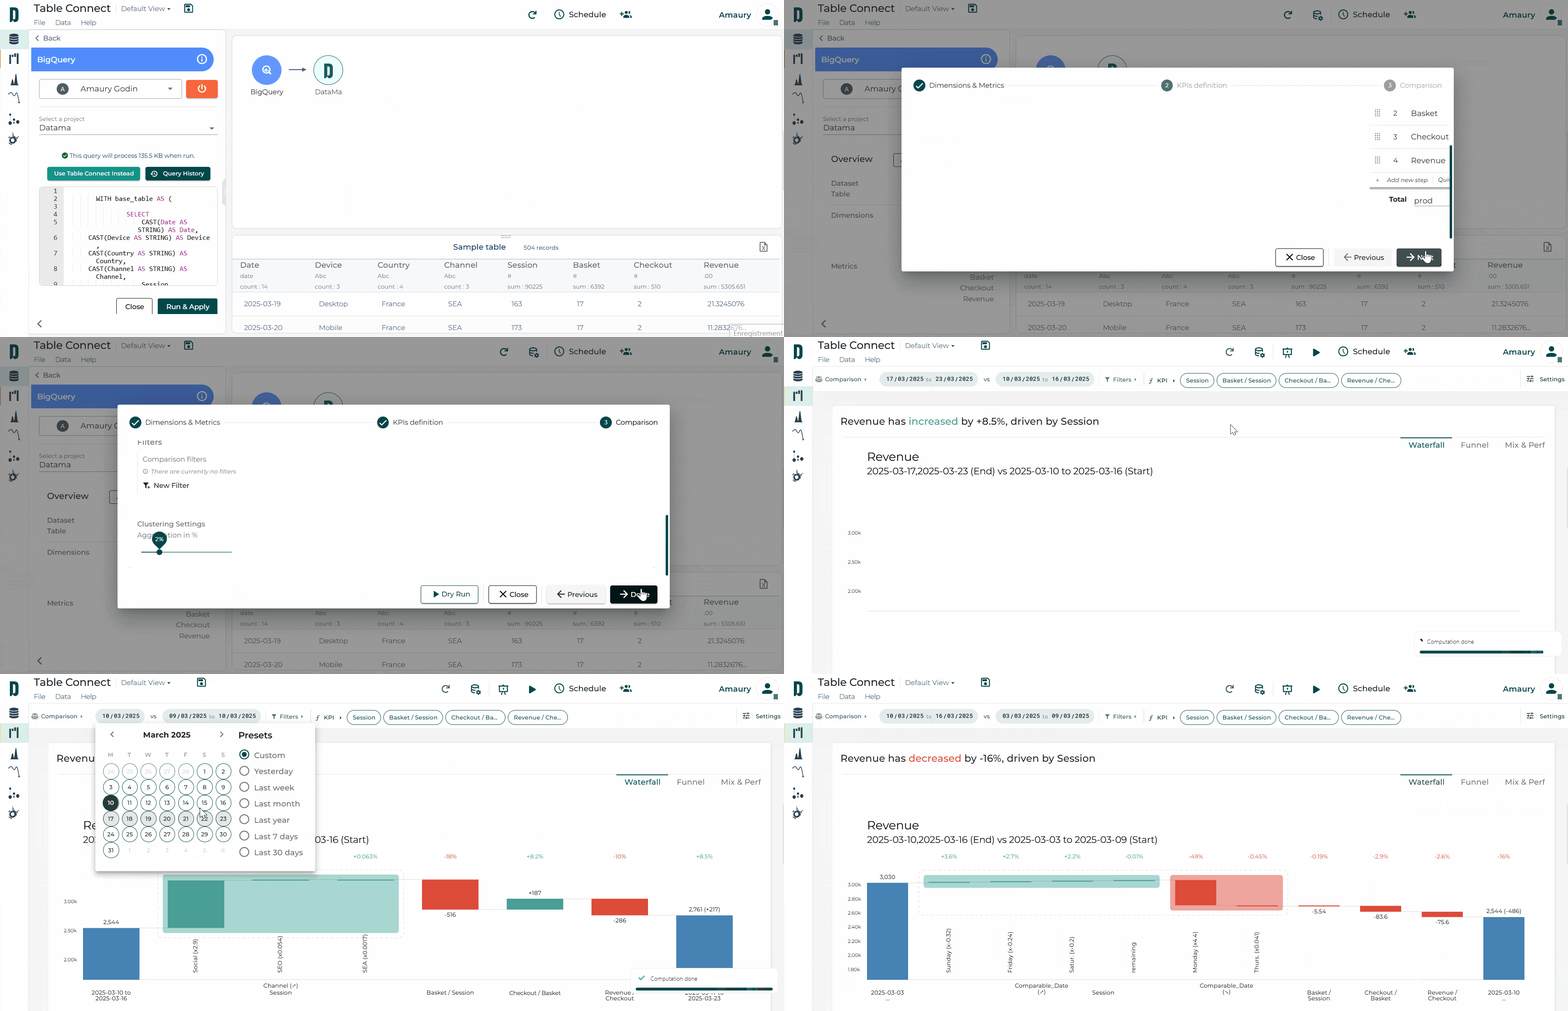
You can now link Datama directly to a full table in Prep—no need to write a specific SQL query. Just connect your table in BigQuery, Snowflake, or Redshift, and handle all your filtering, comparisons, and clustering directly in Datama with our NoCode feature.
⚡Datama pulls only the data you need, auto-aggregates dimensions, and keeps things light and fast—so you can focus on insights.
🗒️Please note that after a table connect block, data refinement blocks cannot be used for the moment (e.g. “Clean”, “Aggregate” …).
Smarter connections, faster insights. Try it out! 💡
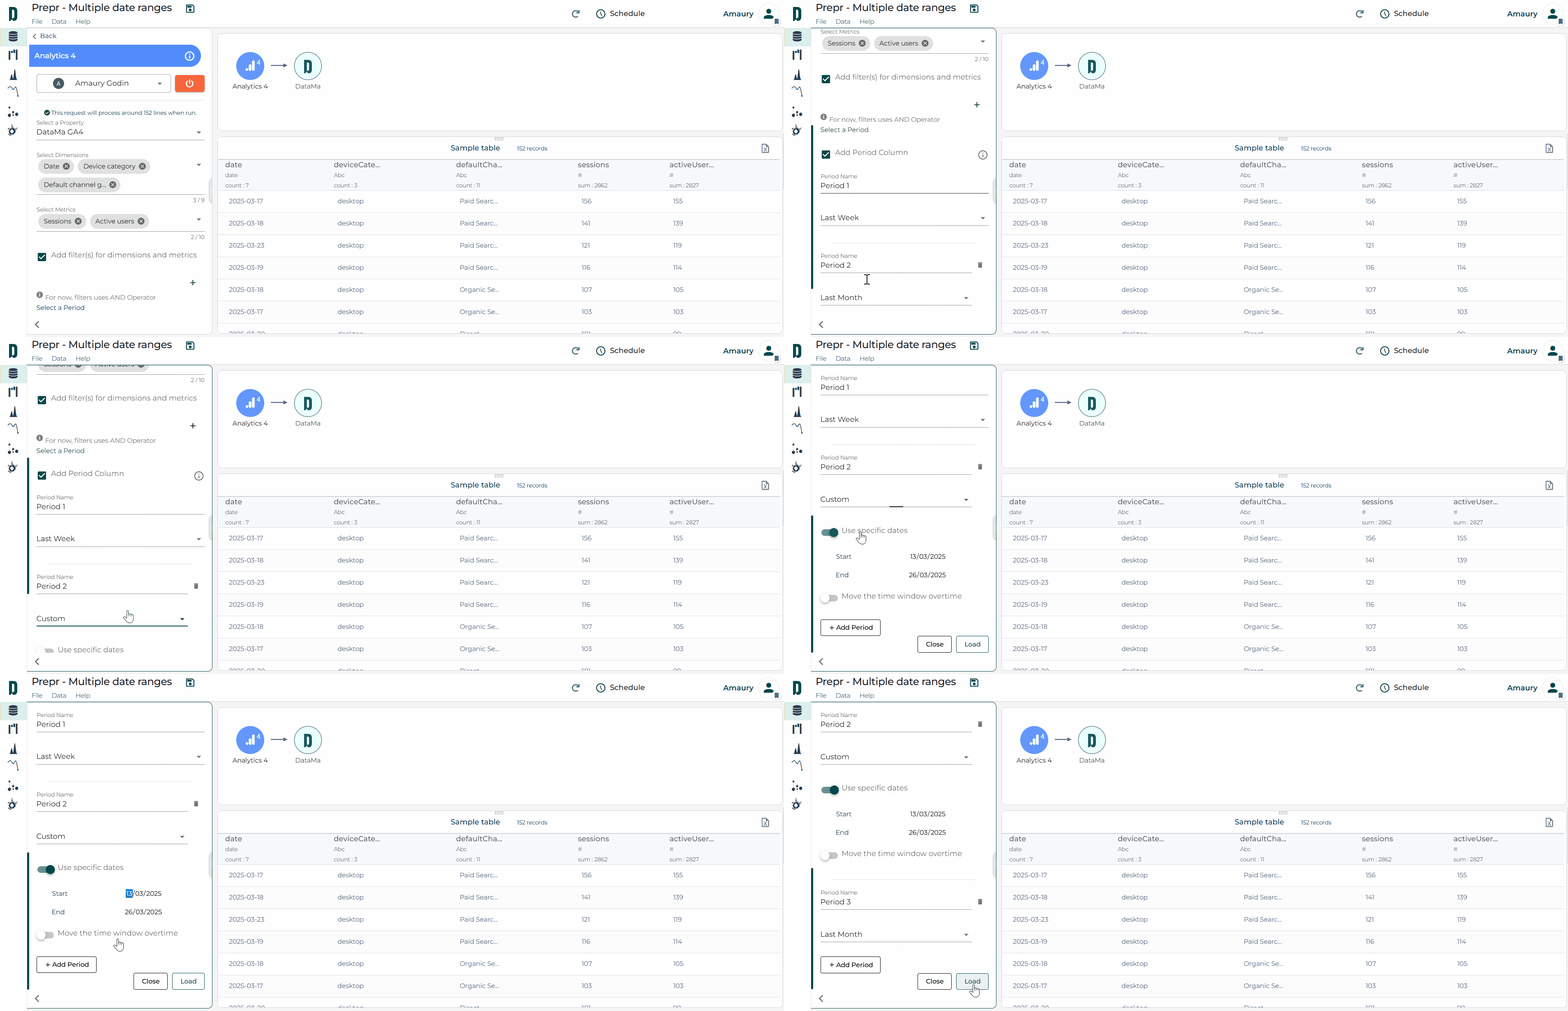
Datama Prep «multiple date ranges» available for GA4 and Piano sources!
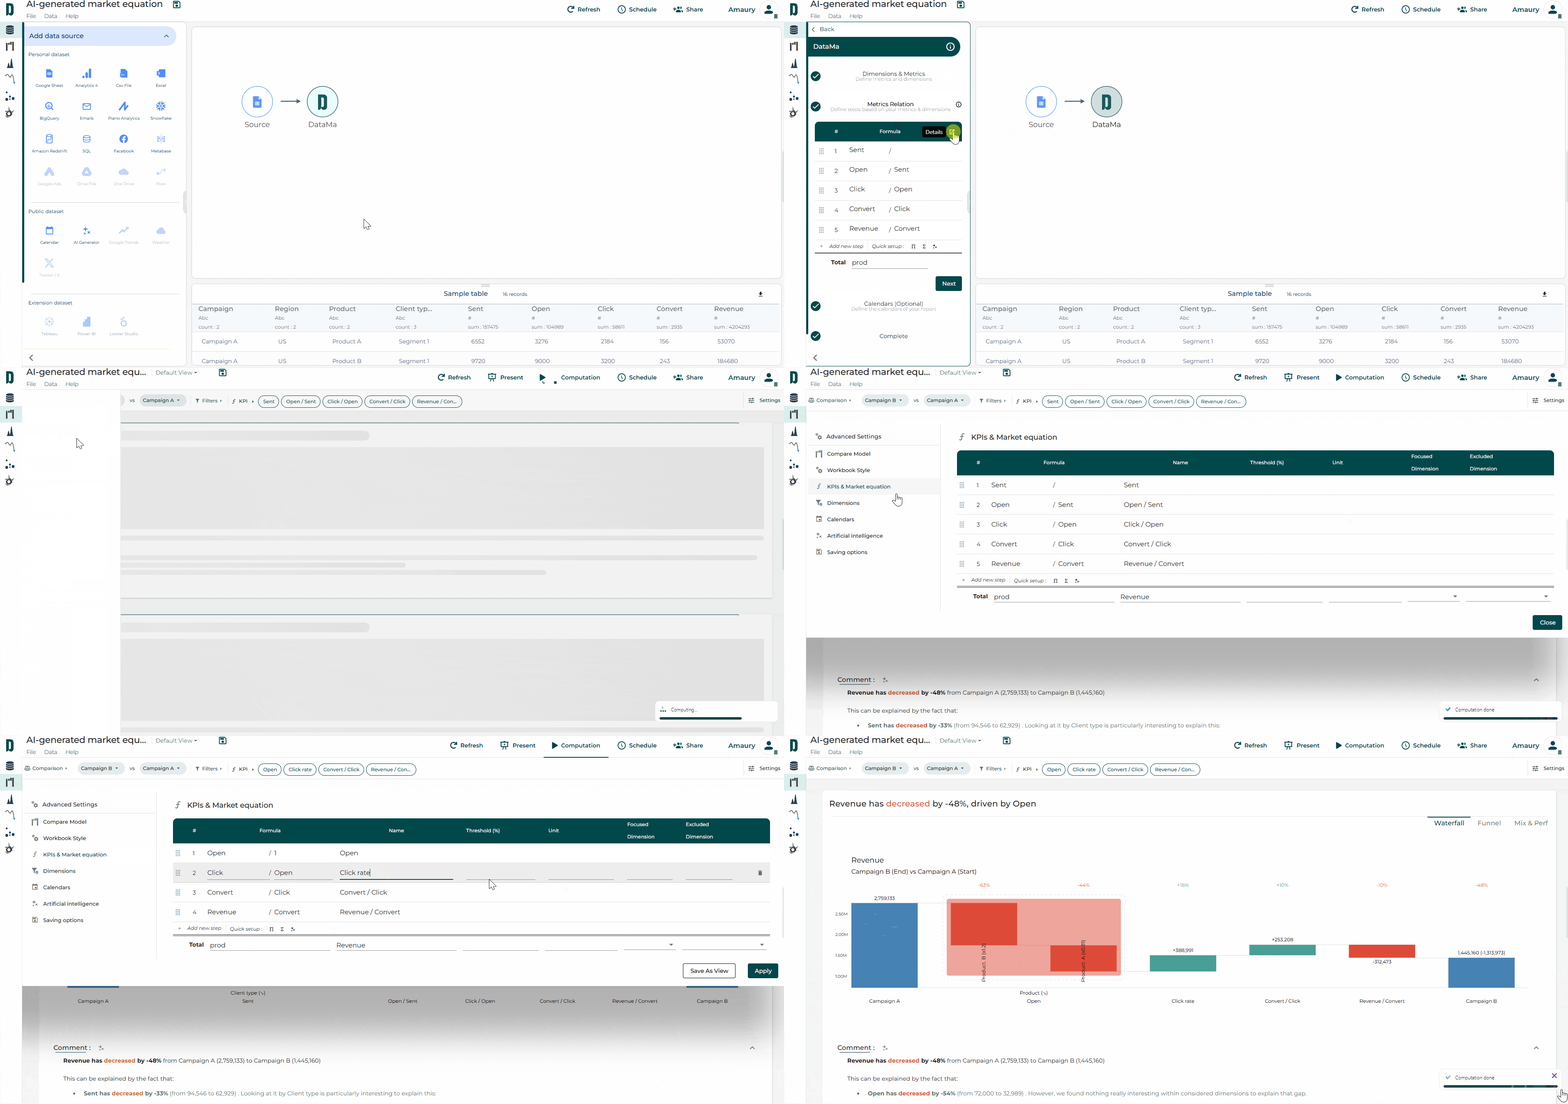
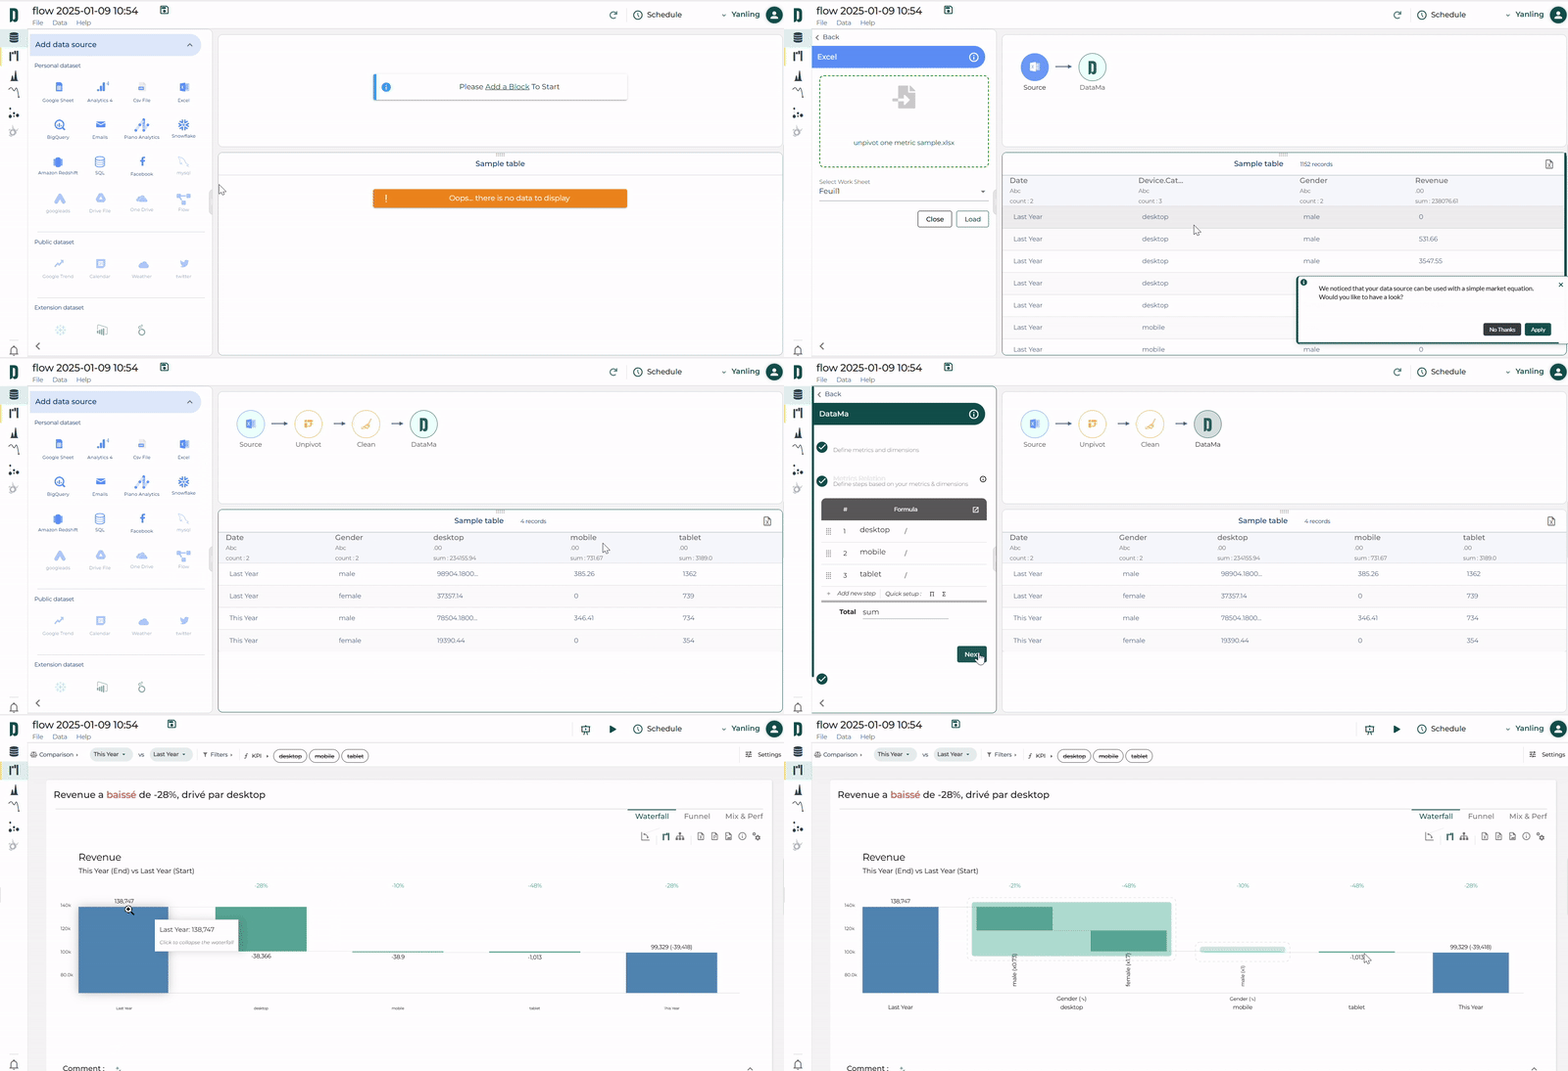
Got a single summable metric in your table without an suggested market equation? Unlock its full potential with the Datama Unpivot function! 🌟
This tool suggests you unpivoting your unique metric on a dimension of the dataset and automatically create the market equation to match the sum of each segment of that dimension. 👇
You can then easily analyse by “Dimension then Dimension” in Datama Compare! 👇
How to use it: 🔧
Upload your data source with a single metric, and click “Apply” of the pop-up at the bottom right. ➕
Select Datama block then click “Define steps” to review the automatically summarized metric equations by dimension categories in the left panel. 📂
Click below “Open in Compare” to explore metric KPIs across dimension categories. ✅
📊 Make your limited data source tell more than expected!
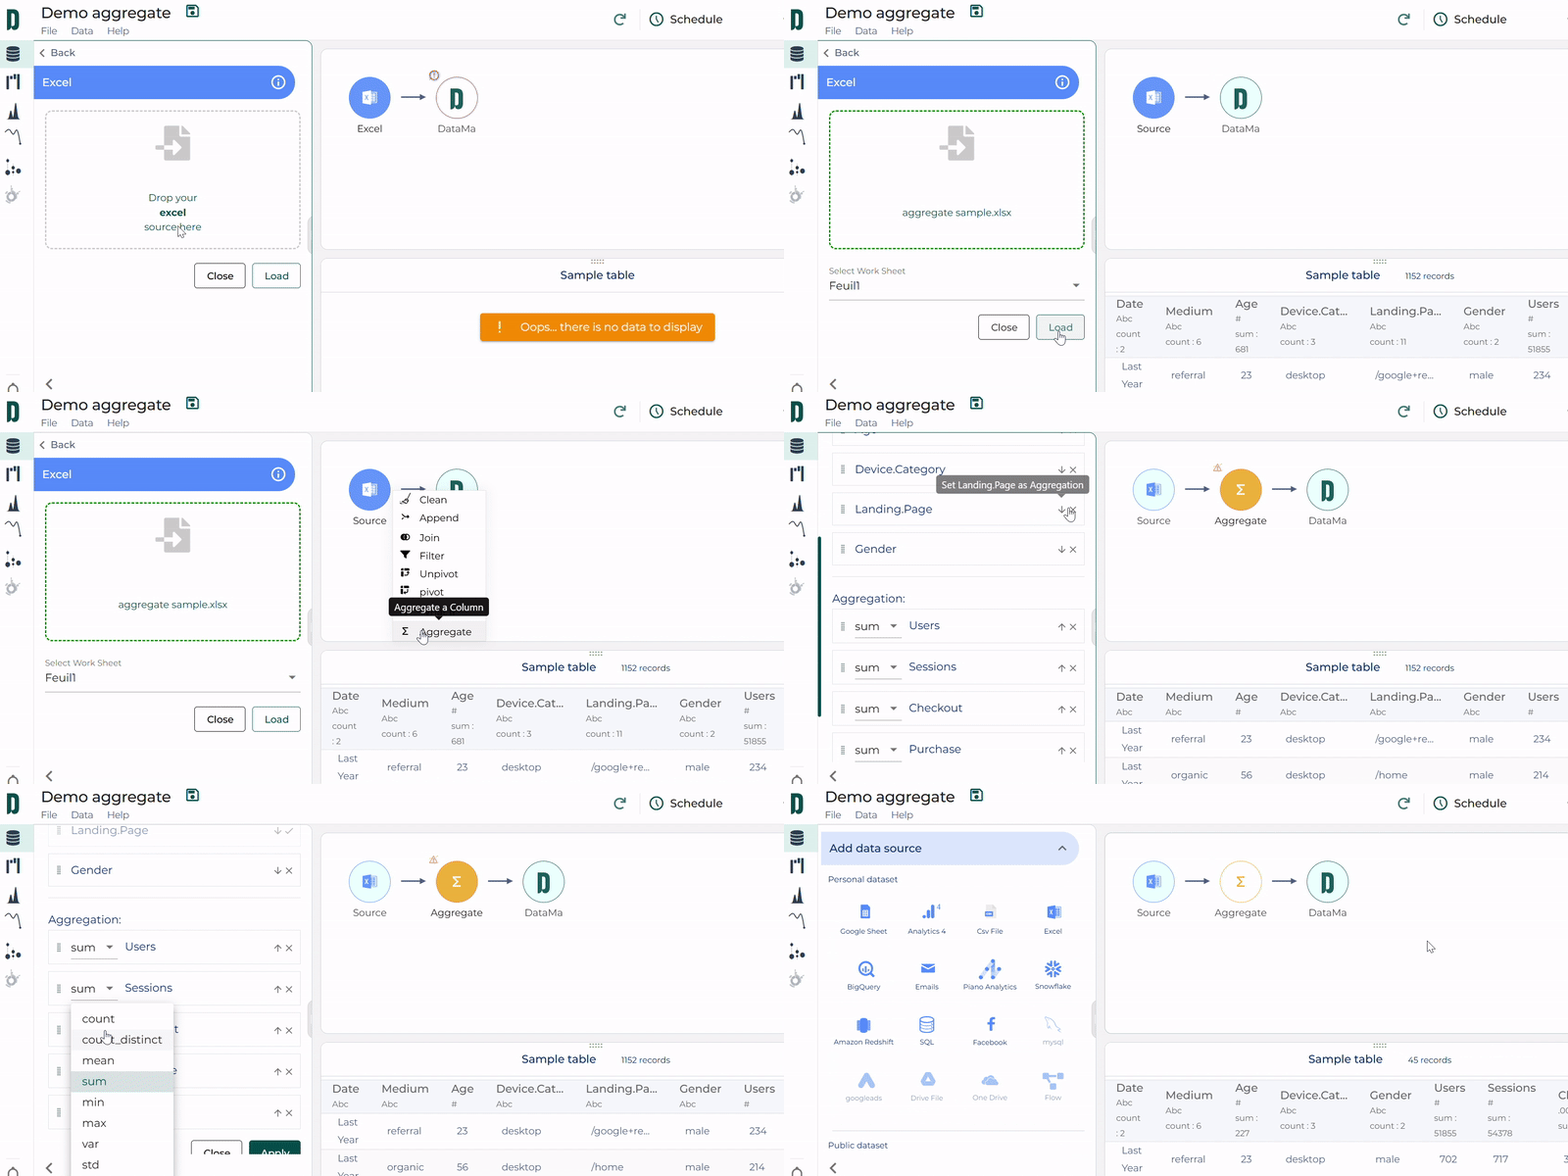
Optimize your data with the Datama Aggregation block! 🌟
Struggling with massive datasets? Want to reduce them without losing key insights? ✂️
Discover the Datama Aggregation block!
This tool in Datama Prep lets you group by one or more keys (dimensions) and apply aggregations like sum, mean, or max… to your metrics.
✨ The result? A lighter, more manageable dataset.
How to use it: 🔧
Click + at the top right of your source block. ➕
Select Aggregate and adjust the keys and aggregation settings in the left panel. 📂
Click Apply to instantly get a condensed output table! ✅
📊 Streamline your data—your way!
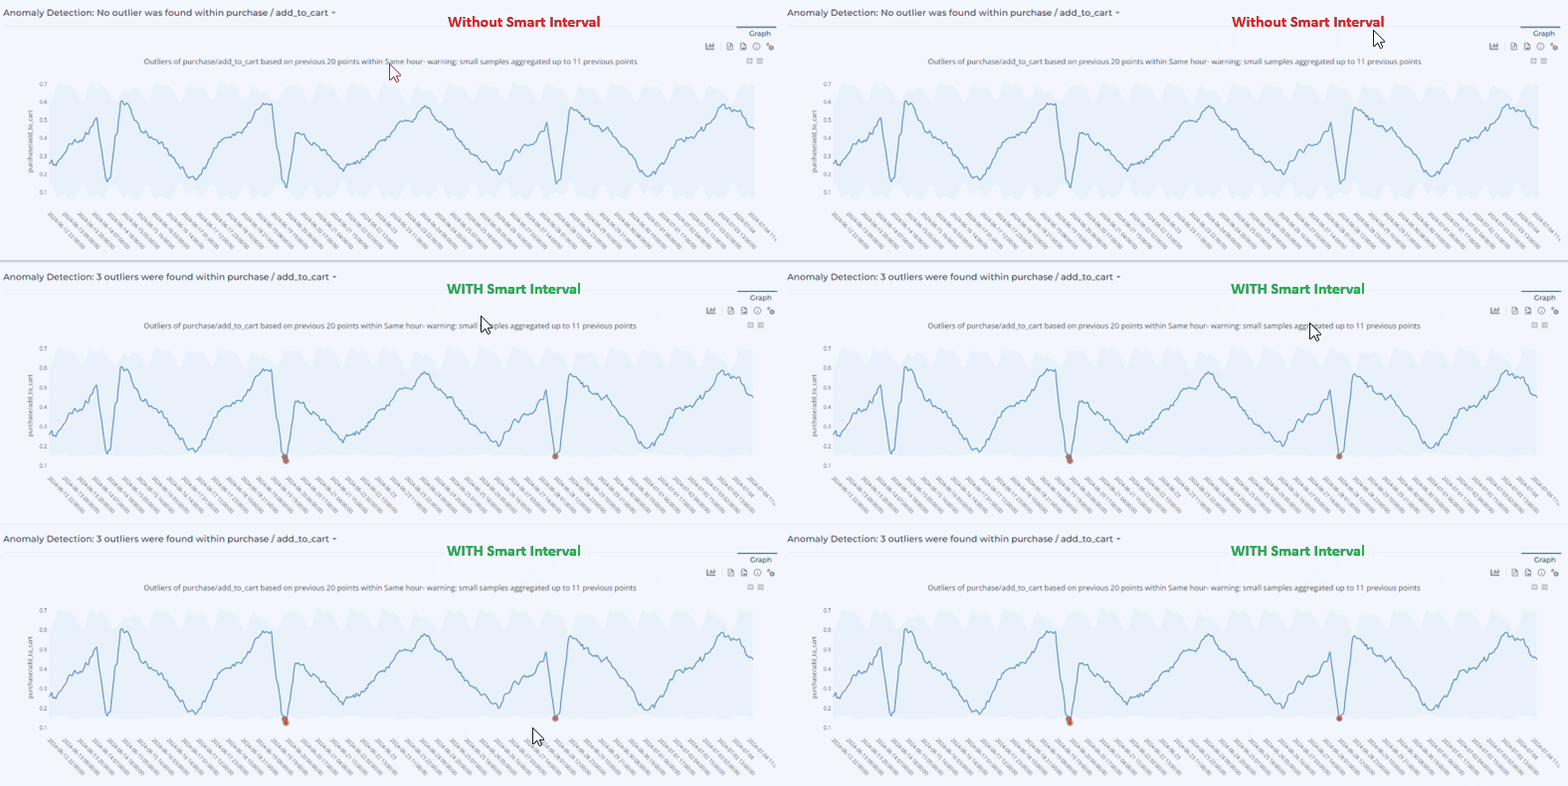
Take advantage of Smart Interval for more accurate anomaly detection 📈
In Datama Detect, when using observed volatility to detect anomalies, the “Smart Interval” button is enabled by default (Settings > Detect methodology > Use smart interval). 😊
Smart Interval calculates a theoretical confidence interval using the Wilson method. This improves the accuracy of anomaly detection, especially for values close to 0 and/or for detecting hourly anomalies. 🧠
Try it out to optimize your ratio analysis! 🎯
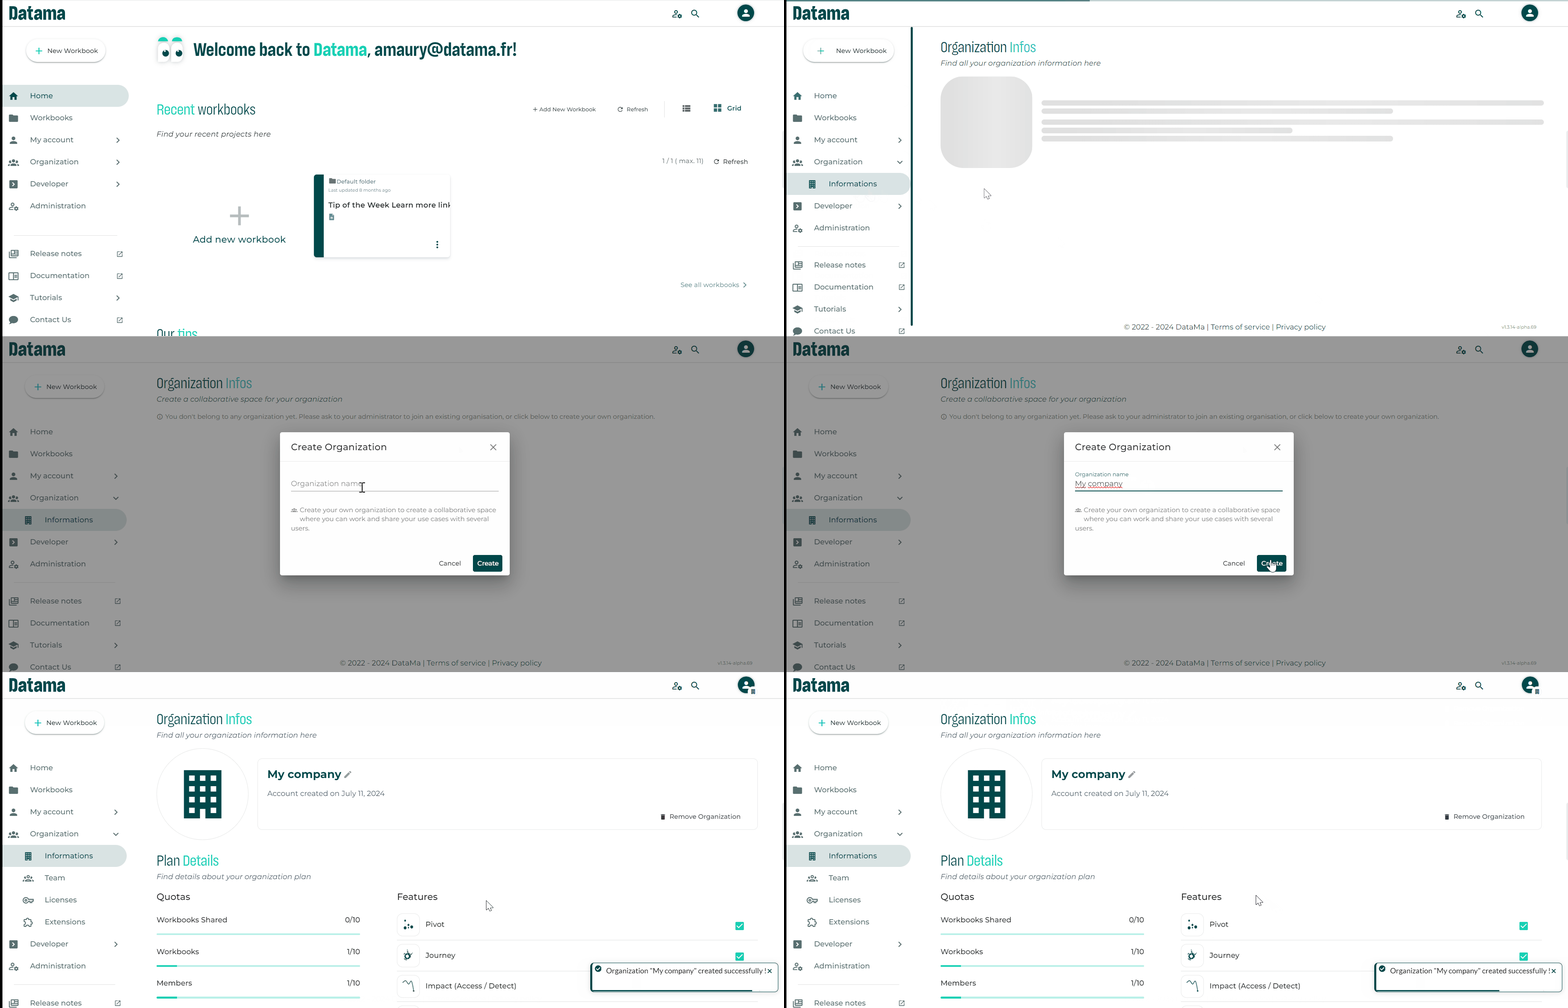
Create Your Organization and Invite Your Team Members!
By creating your own organization, you can now have a collaborative space where you can work and share your use cases with several users 🤝
In a few clicks:
Create your Organization 🏢
Invite your team members 📧
Manage all accesses 🔐
The feature is in beta for now, so ask for Beta access from your CSM and then click on “Organization > Information” to start creating your organization! 👥
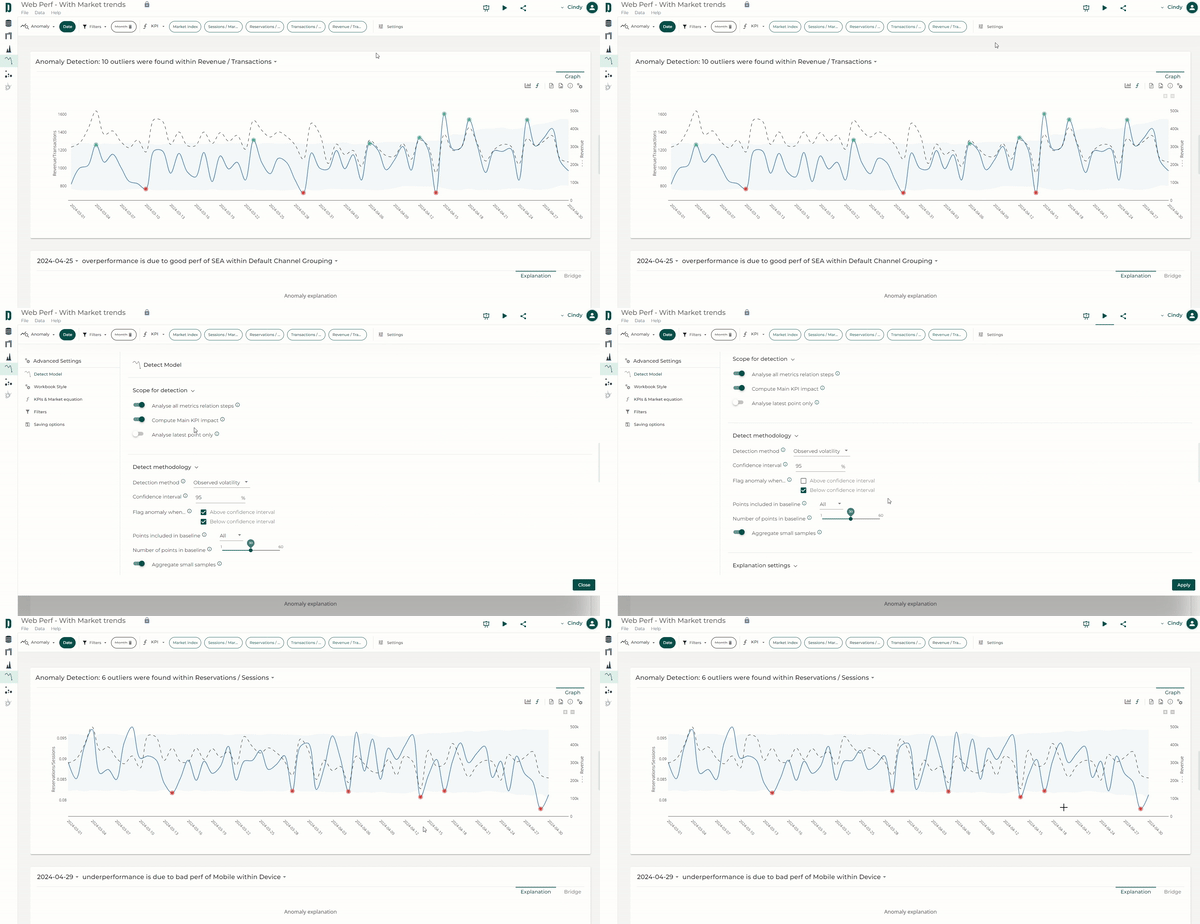
Only flag anomalies above or below the confidence interval
Using Datama Detect, you can send instant notifications for when your key metrics fall outside of the confidence interval 🔔 Now, you can decide to flag anomalies only above or below confidence interval using the appropriate input in the settings ⚙️ This allows to get notified only when a KPI goes down (aka “bad news” 😅) , for instance.
Of course, you can also choose to only keep those above ⬆️, or keep the default of showing both ⬆️⬇️